|
Summary for |
July
2008 |
|
Mean Max: |
21.1ºC |
(-0.2ºC) |
|
Mean Min: |
12.6ºC |
(+0.4ºC) |
|
Mean: |
16.9ºC |
(+0.1ºC) |
|
|
|
|
|
High Max: |
27.1ºC |
28th |
|
Low Max: |
17.3ºC |
9th |
|
High Min: |
17.1ºC |
25th |
|
Low Min: |
7.7ºC |
4th |
|
Mean Grass Min: |
11.4ºC |
|
|
Grass Min: |
6.1ºC |
4th |
|
|
|
|
|
Rain Total (gauge): |
112.9 mm |
(277%) |
|
Rain Total (tipping bucket): |
98.6 mm |
|
|
Rain Days >0.2 mm: |
15 Days |
|
|
Rain Days >1.0 mm: |
11 Days |
|
|
Max 24 hrs: |
31.9 mm |
9th |
|
Days without any rain: |
16 |
|
|
|
|
|
|
Air Frost: |
0 Days |
|
|
Ground Frost: |
0 Days |
|
|
Snow Falling: |
0 Days |
|
|
Snow (50%) @ 9am: |
0 Days |
|
|
Thunder Heard: |
0 Days |
|
|
Hail <5 mm: |
0 Days |
|
|
Hail >5 mm: |
0 Days |
|
|
Fog @ 9am: |
1 Day |
|
|
|
|
|
|
Total Monthly Sunshine: |
188h:06m |
|
|
Total Monthly Sunshine: |
187.8 Hours |
|
|
Most Sunshine in a Day: |
14h:56m |
27th |
|
Average Daily Sunshine: |
06h:04m |
|
|
Sunless Days: |
1 Days |
|
|
Cloudless Days: |
3 Days |
|
|
Total Possible Sunshine: |
494h:50m |
|
|
Percentage of Total Sun: |
38% |
|
|
|
|
|
|
Mean Soil Temp @ 30 cm: |
16.5ºC |
|
|
Min Soil Temp @ 30 cm: |
15.1ºC |
7th |
|
Max Soil Temp @ 30 cm: |
18.8ºC |
28th |
|
Mean Soil Temp @ 100 cm: |
14.8ºC |
|
|
Min Soil Temp @ 100 cm: |
14.2ºC |
7th |
|
Max Soil Temp @ 100 cm: |
16.0ºC |
28th |
|
|
|
|
|
Mean 10 Min Wind >39 mph: |
0.0 Days |
|
|
N: |
0.40 Days |
|
|
NE: |
0.90 Days |
|
|
E: |
2.72 Days |
|
|
SE: |
4.55 Days |
|
|
S: |
6.27 Days |
|
|
SW: |
3.02 Days |
|
|
W: |
6.95 Days |
|
|
NW: |
4.54 Days |
|
|
Calm: |
4.50 Days |
|
|
Mean Wind: |
5 mph |
|
|
Max Gust: |
35 mph |
5th |
|
|
|
|
|
Mean Cloud Cover: |
62% |
|
|
Mean RH @ 9am: |
84% |
|
|
Rain Duration >0.1mm/hour: |
50.0 Hours |
|
|
Frost Duration: |
0.0 Hours |
|
|
Max Frost Duration in a Day: |
0.0 Hours |
|
|
|
|
|
|
Mean Sea Temperature: |
16.7ºC |
|
|
Normal for Month: |
|
|
|
Max Sea Temperature: |
18.7ºC |
27th |
|
Min Sea Temperature: |
15.8ºC |
9th |
|
|
|
|
|
Mean Pressure @ 9am: |
1013.7 hPa |
(-4.1 hPa) |
|
Mean Pressure: |
1013.5 hPa |
(-4.3 hPa) |
|
Max Pressure: |
1027.6 hPa |
22nd |
|
Min Pressure: |
995.9 hPa |
7th |
|
|
|
|
|
Max Dewpoint: |
17.0ºC |
28th |
|
Min Dewpoint: |
3.8ºC |
4th |
|
Mean Dewpoint: |
11.1ºC |
|
|
|
|
|
|
Max Humidity: |
92% |
9th |
|
Min Humidity: |
37% |
27th |
|
Mean Humidity: |
74% |
(-2) |
|
|
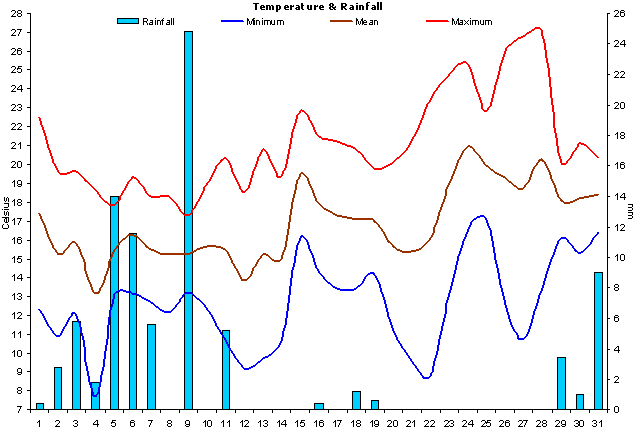
A month of two
halves. The
first half was very wet (90.8 mm); cool (mean 15.6°C);
cloudy (72 hours of sun). Whilst the second half was
drier (22.1 mm); warmer (mean 18.1°C); sunnier (116
hours of sun). The last week of the month had a run of
very warm nights for this location. Night time
temperatures were warmer than normal but daytime
temperatures were slightly below making the monthly mean
just 0.1°C above the LTA. Overall a warmer, sunnier but
wetter month than the dismal July of last year. |
|
Rainfall was exceptional!
Most of which fell on two separate occasions leaving 16
days with no rain at all. |
|
As usual in a summer month
there were no air or grass
frosts. No thunder was recorded which is unusual for a
summer month. |
|
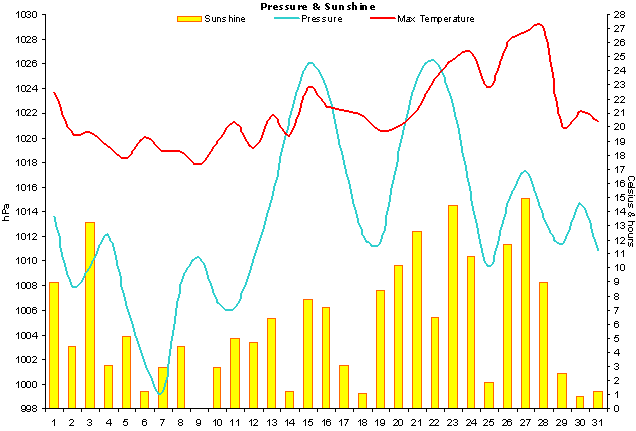
Sunshine levels were
below average for July, especially during the first 2
weeks. |
|
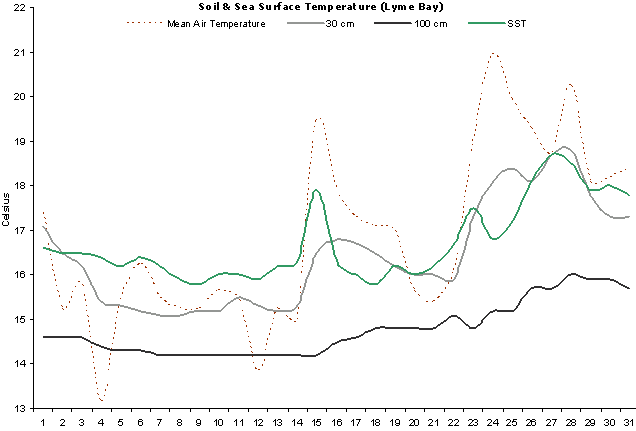
Soil temperatures remained
around normal throughout. |
|
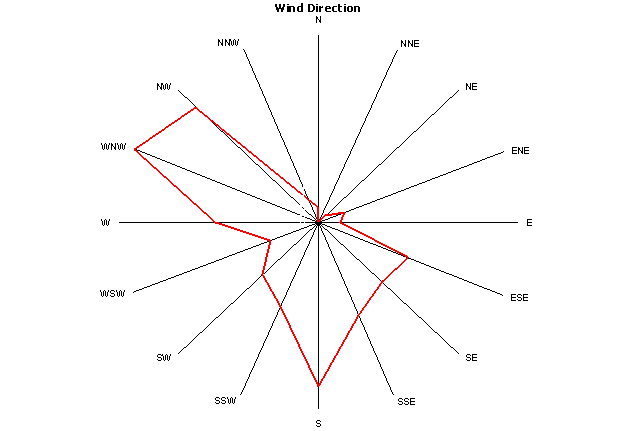
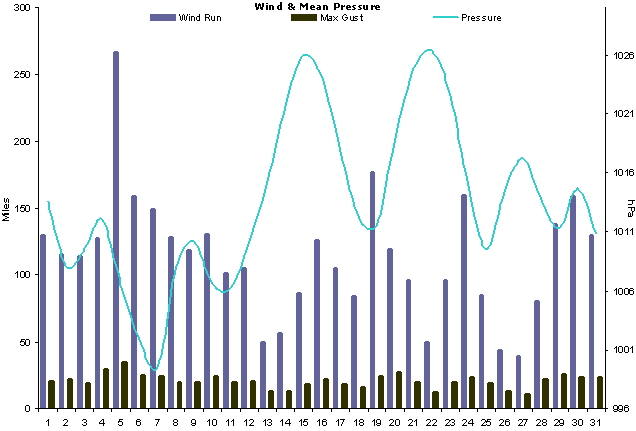
Winds were all over the
place, from all directions except the north. This shows
what a cyclonic month this July was. |
|
For such a wet month it
was actually raining for only 50 hours. |
|
Sea temperatures rose
gradually throughout the month and on the whole were
around average or slightly above. |
|
Mean pressure was was -4.3 hPa below normal and indicative of the
generally unsettled nature of this month dominated by
low pressure systems. |
|
Dewpoints were generally
quite low until the end of the month. |
|
With a mean relative humidity
of 74%, this was 2 percentage points below normal. |
|
|
|
Weather Data for Otter Valley, Devon. |
July 2008 |
|
|
|
Temp (oC) |
Hum (RH%) |
Dewpoint (oC) |
Wind (mph) |
Rain |
Pressure (hPa) |
Grass |
Sun |
|
|
|
Min |
Max |
Ave |
Min |
Max |
Ave |
Min |
Max |
Ave |
Max |
Ave |
Run |
mm |
Min |
Max |
Ave |
Min |
Hours |
Observations |
|
1 |
12.3 |
22.5 |
17.4 |
57 |
88 |
73 |
8.0 |
14.0 |
11.0 |
21 |
5.4 |
129 |
0.4 |
1008 |
1019 |
1014 |
8.4 |
8.9 |
Sunny, rain evening |
|
2 |
10.9 |
19.6 |
15.3 |
70 |
91 |
81 |
7.9 |
14.0 |
11.0 |
22 |
4.8 |
115 |
2.8 |
1007 |
1009 |
1008 |
9.6 |
4.4 |
Sunny intervals all day |
|
3 |
12.0 |
19.6 |
15.8 |
55 |
90 |
73 |
8.6 |
12.0 |
10.3 |
19 |
4.8 |
114 |
5.8 |
1006 |
1014 |
1010 |
11.2 |
13.2 |
Sunny intervals all day |
|
4 |
7.7 |
18.6 |
13.2 |
62 |
90 |
76 |
3.8 |
11.1 |
7.5 |
30 |
5.3 |
127 |
1.8 |
1009 |
1015 |
1012 |
6.1 |
3.1 |
Sunny intervals all day |
|
5 |
13.1 |
17.8 |
15.5 |
73 |
91 |
82 |
10.1 |
13.1 |
11.6 |
35 |
11.1 |
266 |
14.0 |
1004 |
1009 |
1006 |
12.9 |
5.2 |
Sunny am, rain pm |
|
6 |
13.2 |
19.3 |
16.3 |
70 |
91 |
81 |
9.5 |
13.2 |
11.4 |
25 |
6.6 |
159 |
11.6 |
999 |
1005 |
1002 |
12.7 |
1.2 |
Sunshine & showers all day |
|
7 |
12.7 |
18.3 |
15.5 |
67 |
91 |
79 |
9.0 |
12.7 |
10.9 |
24 |
6.2 |
149 |
5.6 |
996 |
1003 |
1000 |
12.9 |
3.0 |
Showers then sunny ints |
|
8 |
12.2 |
18.3 |
15.3 |
61 |
84 |
73 |
8.0 |
10.5 |
9.3 |
20 |
5.3 |
128 |
0.0 |
1003 |
1013 |
1008 |
11.1 |
4.4 |
Sunny intervals all day |
|
9 |
13.2 |
17.3 |
15.3 |
72 |
92 |
82 |
8.7 |
14.6 |
11.7 |
20 |
4.9 |
118 |
24.8 |
1007 |
1014 |
1010 |
11.8 |
0.0 |
Rain all day |
|
10 |
12.3 |
19.0 |
15.7 |
68 |
91 |
80 |
9.8 |
13.4 |
11.6 |
24 |
5.4 |
131 |
0.0 |
1005 |
1008 |
1007 |
10.8 |
2.9 |
Sunny intervals all day |
|
11 |
10.6 |
20.3 |
15.5 |
64 |
91 |
78 |
7.5 |
13.1 |
10.3 |
20 |
4.2 |
102 |
5.2 |
1004 |
1008 |
1006 |
10.1 |
5.0 |
Sunshine & showers all day |
|
12 |
9.2 |
18.5 |
13.9 |
53 |
89 |
71 |
5.9 |
9.8 |
7.9 |
21 |
4.4 |
105 |
0.0 |
1008 |
1012 |
1010 |
7.9 |
4.7 |
Sunny intervals all day |
|
13 |
9.7 |
20.8 |
15.3 |
57 |
89 |
73 |
5.5 |
11.9 |
8.7 |
13 |
2.1 |
50 |
0.0 |
1012 |
1018 |
1015 |
8.4 |
6.4 |
Sunny intervals all day |
|
14 |
10.6 |
19.4 |
15.0 |
72 |
89 |
81 |
6.6 |
14.2 |
10.4 |
13 |
2.4 |
57 |
0.0 |
1018 |
1025 |
1022 |
9.6 |
1.2 |
Sunny ints am, cloudy pm |
|
15 |
16.1 |
22.8 |
19.5 |
61 |
90 |
76 |
12.2 |
16.2 |
14.2 |
18 |
3.6 |
86 |
0.0 |
1025 |
1027 |
1026 |
15.4 |
7.8 |
Sunny intervals all day |
|
16 |
14.3 |
21.5 |
17.9 |
52 |
88 |
70 |
8.9 |
12.4 |
10.7 |
22 |
5.3 |
126 |
0.4 |
1022 |
1026 |
1024 |
12.7 |
7.2 |
Sunny intervals all day |
|
17 |
13.4 |
21.2 |
17.3 |
59 |
84 |
72 |
9.0 |
12.2 |
10.6 |
18 |
4.4 |
105 |
0.0 |
1014 |
1022 |
1018 |
11.8 |
3.0 |
Sunny intervals all day |
|
18 |
13.4 |
20.8 |
17.1 |
70 |
87 |
79 |
9.1 |
14.5 |
11.8 |
16 |
3.5 |
84 |
1.2 |
1010 |
1014 |
1012 |
11.8 |
1.1 |
Sunny ints am, showers pm |
|
19 |
14.2 |
19.8 |
17.0 |
59 |
89 |
74 |
9.8 |
12.7 |
11.3 |
24 |
7.3 |
176 |
0.6 |
1008 |
1015 |
1011 |
13.5 |
8.4 |
Sunny intervals all day |
|
20 |
11.2 |
20.1 |
15.7 |
50 |
88 |
69 |
6.2 |
9.8 |
8.0 |
27 |
4.9 |
119 |
0.0 |
1015 |
1023 |
1019 |
9.3 |
10.2 |
Sunny intervals all day |
|
21 |
9.6 |
21.2 |
15.4 |
50 |
89 |
70 |
5.3 |
10.2 |
7.8 |
20 |
4.0 |
96 |
0.0 |
1023 |
1027 |
1025 |
8.7 |
12.6 |
Sunny all day |
|
22 |
8.8 |
23.4 |
16.1 |
50 |
68 |
59 |
10.2 |
13.8 |
12.0 |
12 |
2.1 |
50 |
0.0 |
1025 |
1028 |
1026 |
8.6 |
6.5 |
Sunny intervals all day |
|
23 |
13.2 |
24.8 |
19.0 |
43 |
90 |
67 |
9.3 |
15.4 |
12.4 |
20 |
4.0 |
96 |
0.0 |
1019 |
1026 |
1023 |
12.2 |
14.4 |
Sunny all day |
|
24 |
16.6 |
25.3 |
21.0 |
44 |
79 |
62 |
10.9 |
13.8 |
12.4 |
23 |
6.7 |
160 |
0.0 |
1010 |
1020 |
1015 |
14.1 |
10.8 |
Sunny am, sunny ints pm |
|
25 |
17.1 |
22.8 |
20.0 |
54 |
84 |
69 |
10.7 |
15.8 |
13.3 |
19 |
3.5 |
85 |
0.0 |
1007 |
1012 |
1010 |
16.0 |
1.9 |
Sunny intervals all day |
|
26 |
12.6 |
26.0 |
19.3 |
50 |
89 |
70 |
9.3 |
15.3 |
12.3 |
13 |
1.8 |
43 |
0.0 |
1012 |
1017 |
1015 |
11.4 |
11.7 |
Misty early am then sunny |
|
27 |
10.7 |
26.8 |
18.8 |
37 |
87 |
62 |
7.0 |
15.0 |
11.0 |
11 |
1.6 |
39 |
0.0 |
1016 |
1018 |
1017 |
10.2 |
14.9 |
Sunny all day |
|
28 |
13.4 |
27.1 |
20.3 |
45 |
87 |
66 |
9.3 |
17.0 |
13.2 |
22 |
3.3 |
80 |
0.0 |
1010 |
1017 |
1014 |
11.7 |
9.0 |
Sunny am, hazy pm |
|
29 |
16.1 |
20.1 |
18.1 |
75 |
89 |
82 |
11.9 |
15.2 |
13.6 |
26 |
5.7 |
138 |
3.4 |
1009 |
1014 |
1011 |
13.1 |
2.5 |
Sunny ints & showers |
|
30 |
15.3 |
21.1 |
18.2 |
77 |
90 |
84 |
12.3 |
15.0 |
13.7 |
23 |
6.6 |
159 |
1.0 |
1014 |
1016 |
1015 |
14.4 |
0.9 |
Sunny ints, mostly cloudy |
|
31 |
16.4 |
20.4 |
18.4 |
75 |
91 |
83 |
11.8 |
16.3 |
14.1 |
23 |
5.4 |
130 |
9.0 |
1006 |
1015 |
1011 |
15.3 |
1.2 |
Sunny ints am, rain pm |
|
|
12.6 |
21.1 |
16.9 |
60 |
88 |
74 |
8.8 |
13.5 |
11.1 |
21 |
4.7 |
3520 |
78.6 |
1011 |
1016 |
1014 |
11.4 |
187.8 |
|
|
|
Graphs for July 2008 |
 |
|
Figure 1. Temperature and
Rainfall for July 2008. |
 |
|
Figure 2. Sunshine, air
pressure and mean wind speed for July 2008. |
 |
|
Figure 3.
Wind direction for July 2008. |
 |
|
Figure 4. Soil & sea surface
temperature (SST) for Lyme Bay for July 2008. |
 |
|
Figure 5.
Wind run, maximum
gusts and mean
pressure for July 2008. |
| |