|
Summary for |
April
2009 |
|
Mean Max: |
15.7ºC |
(+3.0ºC) |
|
Mean Min: |
6.0ºC |
(+1.6ºC) |
|
Mean: |
10.8ºC |
(+2.3ºC) |
|
|
|
|
|
High Max: |
22.2ºC |
20th |
|
Low Max: |
11.8ºC |
9th |
|
High Min: |
11.1ºC |
30th |
|
Low Min: |
0.3ºC |
13th |
|
Mean Grass Min: |
2.7ºC |
|
|
Grass Min: |
-2.8ºC |
13th |
|
|
|
|
|
Rain Total (gauge): |
51.4 mm |
(114%) |
|
Rain Total (tipping bucket): |
50.9 mm |
(113%) |
|
Rain Days >0.2 mm: |
14 Days |
|
|
Rain Days >1.0 mm: |
11 Days |
|
|
Max 24 hrs: |
11.0 mm |
27th |
|
Days without any rain: |
16 |
|
|
|
|
|
|
Air Frost: |
0 Days |
|
|
Ground Frost: |
2 Days |
|
|
Snow Falling: |
0 Days |
|
|
Snow (50%) @ 9am: |
0 Days |
|
|
Thunder Heard: |
1 Days |
|
|
Hail <5 mm: |
0 Days |
|
|
Hail >5 mm: |
0 Days |
|
|
Fog @ 9am: |
0 Days |
|
|
|
|
|
|
Total Monthly Sunshine: |
184h:30m |
|
|
Total Monthly Sunshine: |
184.5 Hours |
|
|
Most Sunshine in a Day: |
13h:32m |
19th |
|
Average Daily Sunshine: |
06h:09m |
|
|
Sunless Days: |
0 Days |
|
|
Cloudless Days: |
14 Days |
|
|
Total Possible Sunshine: |
415h:33m |
|
|
Percentage of Total Sun: |
44% |
|
|
|
|
|
|
Mean Soil Temp @ 30 cm: |
11.5ºC |
|
|
Min Soil Temp @ 30 cm: |
10.3ºC |
1st |
|
Max Soil Temp @ 30 cm: |
13.0ºC |
22nd |
|
Mean Soil Temp @ 100 cm: |
10.1ºC |
|
|
Min Soil Temp @ 100 cm: |
8.1ºC |
1st |
|
Max Soil Temp @ 100 cm: |
10.8ºC |
23rd |
|
|
|
|
|
Mean 10 Min Wind >39 mph: |
0.1 Days |
|
|
N: |
3.32 Days |
|
|
NE: |
2.31 Days |
|
|
E: |
4.11 Days |
|
|
SE: |
9.51 Days |
|
|
S: |
1.41 Days |
|
|
SW: |
0.94 Days |
|
|
W: |
3.39 Days |
|
|
NW: |
1.61 Days |
|
|
Calm: |
3.40 Days |
|
|
Mean Wind: |
4 mph |
|
|
Max Gust: |
34 mph |
8th |
|
|
|
|
|
Mean Cloud Cover: |
61% |
|
|
Mean RH @ 9am: |
85% |
|
|
Rain Duration >0.1mm/hour: |
36.0 Hours |
|
|
Frost Duration: |
0.0 Hours |
|
|
Max Frost Duration in a Day: |
0.0 Hours |
|
|
|
|
|
|
Mean Sea Temperature: |
10.9ºC |
|
|
Normal for Month: |
|
|
|
Max Sea Temperature: |
12.5ºC |
22nd |
|
Min Sea Temperature: |
9.3ºC |
3rd |
|
|
|
|
|
Mean Pressure @ 9am: |
1013.1 hPa |
(-3.1 hPa) |
|
Mean Pressure: |
1012.3 hPa |
(-3.9 hPa) |
|
Max Pressure: |
1029.0 hPa |
22nd |
|
Min Pressure: |
994.7 hPa |
27th |
|
|
|
|
|
Max Dewpoint: |
11.0ºC |
15th |
|
Min Dewpoint: |
-2.8ºC |
13th |
|
Mean Dewpoint: |
5.3ºC |
|
|
|
|
|
|
Max Humidity: |
93% |
9th |
|
Min Humidity: |
36% |
11th |
|
Mean Humidity: |
73% |
(-5) |
|
|
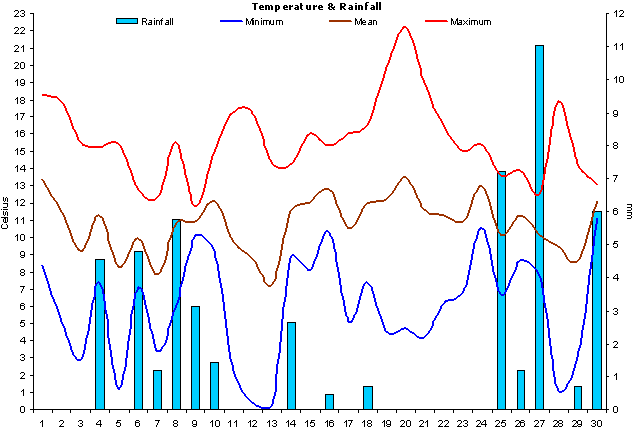
Generally warm and
sunny though the month ended slightly cooler with rain.
A lovely month though
nowhere near and warm and sunny as the exceptional April
of 2007. It was particularly warm from the 10th to the
22nd with the warmest day having a maximum of 22.2°C. |
|
Overall an average month
with regards to rainfall, though most of the rain fell
on just a few days. |
|
There were only 2 grass
frosts and no air frosts making this the third
'frostless' April since 2005. |
|
Sunshine levels were well
above
the average. |
|
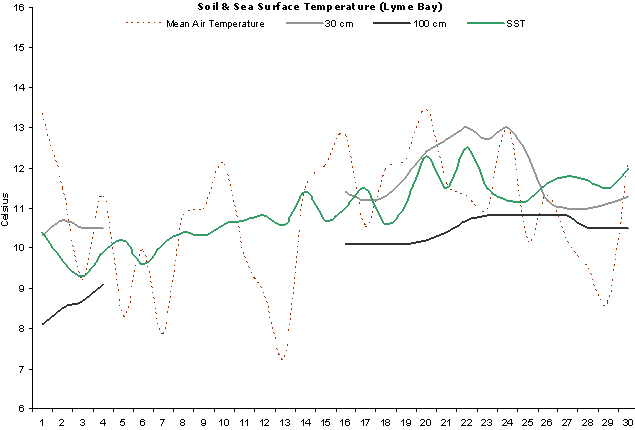
Soil temperatures
were generally around normal at the beginning of the
month but then were above average. |
|
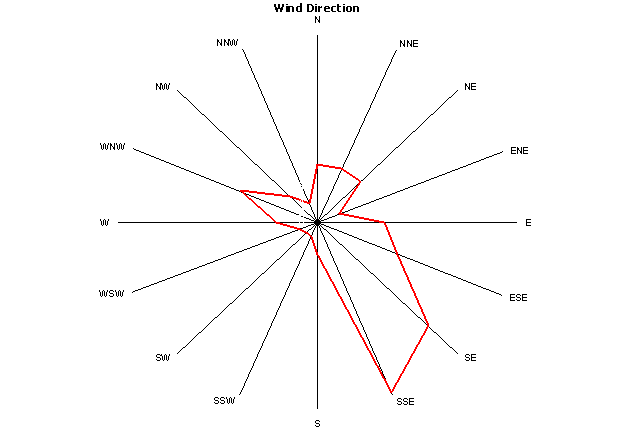
Winds were dominant from the
south-east and east. |
|
Rainfall duration for the
whole month was only 36 hours. |
|
Sea temperatures gradually
rose throughout the month and ended up around normal. |
|
Mean pressure was -3.9 hPa
below normal which is surprising given the generally
settled nature of
this month. |
|
Dewpoints were significantly
low at times throughout the whole of the month. |
|
The dry air through the month meant relative humidity ended up
being well below normal. |
|
|
|
|
Weather Data for Otter Valley, Devon. |
April 2009 |
|
|
|
Temp (oC) |
Hum (RH%) |
Dewpoint (oC) |
Wind (mph) |
Rain |
Pressure (hPa) |
Grass |
Sun |
|
|
|
Min |
Max |
Ave |
Min |
Max |
Ave |
Min |
Max |
Ave |
Max |
Ave |
Run |
mm |
Min |
Max |
Ave |
Min |
Hours |
Observations |
|
1 |
8.4 |
19.6 |
14.0 |
42 |
79 |
61 |
3.1 |
7.3 |
5.2 |
17 |
2.1 |
51 |
0.0 |
1020 |
1023 |
1022 |
6.5 |
5.8 |
Cloudy am, sunny pm |
|
2 |
5.1 |
18.3 |
11.7 |
53 |
86 |
70 |
1.1 |
8.7 |
4.9 |
14 |
2.1 |
50 |
0.0 |
1018 |
1021 |
1020 |
0.3 |
8.8 |
Mist/low cloud am, sunny pm |
|
3 |
2.9 |
15.5 |
9.2 |
67 |
89 |
78 |
0.0 |
8.3 |
4.2 |
13 |
2.0 |
47 |
0.0 |
1015 |
1019 |
1017 |
0.2 |
6.8 |
Sunny am, sea fog pm |
|
4 |
7.4 |
15.2 |
11.3 |
54 |
91 |
73 |
2.2 |
6.9 |
4.6 |
20 |
5.0 |
121 |
4.6 |
1015 |
1024 |
1019 |
4.3 |
8.5 |
Sunny intervals all day |
|
5 |
1.2 |
16.6 |
8.9 |
47 |
89 |
68 |
-1.3 |
6.5 |
2.6 |
14 |
1.9 |
46 |
0.0 |
1017 |
1024 |
1021 |
0.0 |
5.4 |
No observations made
sunshine duration averaged
from
total for this period. |
|
6 |
7.1 |
12.8 |
10.0 |
70 |
90 |
80 |
3.0 |
7.3 |
5.2 |
21 |
4.9 |
117 |
4.8 |
1003 |
1017 |
1010 |
0.0 |
5.4 |
|
7 |
3.4 |
12.3 |
7.9 |
67 |
91 |
79 |
1.3 |
7.0 |
4.2 |
23 |
4.5 |
108 |
1.2 |
1004 |
1008 |
1006 |
0.0 |
5.4 |
|
8 |
6.1 |
16.0 |
11.1 |
49 |
92 |
71 |
3.8 |
8.5 |
6.2 |
34 |
6.7 |
161 |
5.8 |
999 |
1010 |
1005 |
0.0 |
5.4 |
|
9 |
10.1 |
11.8 |
11.0 |
79 |
93 |
86 |
5.6 |
9.4 |
7.5 |
26 |
8.2 |
197 |
3.1 |
1002 |
1010 |
1006 |
0.0 |
5.4 |
|
10 |
9.1 |
15.1 |
12.1 |
66 |
90 |
78 |
4.2 |
9.5 |
6.9 |
21 |
5.1 |
122 |
1.4 |
1000 |
1004 |
1002 |
0.0 |
5.4 |
|
11 |
2.3 |
18.7 |
10.5 |
36 |
89 |
63 |
-0.3 |
4.8 |
2.3 |
13 |
1.5 |
36 |
0.0 |
1005 |
1012 |
1008 |
0.0 |
5.4 |
|
12 |
0.4 |
18.4 |
9.4 |
46 |
89 |
68 |
-2.5 |
7.7 |
2.6 |
14 |
1.5 |
36 |
0.0 |
1012 |
1015 |
1014 |
0.0 |
5.4 |
|
13 |
0.3 |
14.3 |
7.3 |
52 |
89 |
71 |
-2.8 |
6.4 |
1.8 |
20 |
3.3 |
79 |
0.0 |
1008 |
1014 |
1011 |
-2.8 |
5.4 |
|
14 |
8.8 |
14.2 |
11.5 |
67 |
91 |
79 |
4.7 |
8.2 |
6.5 |
13 |
3.2 |
77 |
2.6 |
1006 |
1008 |
1007 |
0.0 |
5.4 |
|
15 |
8.1 |
16.9 |
12.5 |
70 |
88 |
79 |
4.9 |
11.0 |
8.0 |
18 |
4.0 |
96 |
0.0 |
1001 |
1008 |
1004 |
0.0 |
5.4 |
|
16 |
10.3 |
15.3 |
12.8 |
63 |
86 |
75 |
6.1 |
9.1 |
7.6 |
18 |
5.1 |
123 |
0.5 |
1001 |
1008 |
1005 |
0.0 |
5.4 |
Sunny intervals all day |
|
17 |
5.1 |
16.9 |
11.0 |
63 |
91 |
77 |
2.5 |
10.1 |
6.3 |
10 |
0.8 |
19 |
0.0 |
1008 |
1013 |
1011 |
1.7 |
1.8 |
Sunny ints am, cloudy pm |
|
18 |
7.4 |
16.7 |
12.1 |
57 |
87 |
72 |
4.4 |
8.2 |
6.3 |
16 |
2.8 |
68 |
0.7 |
1013 |
1020 |
1016 |
5.8 |
6.0 |
Sunny intervals all day |
|
19 |
4.5 |
20.8 |
12.7 |
49 |
84 |
67 |
1.1 |
9.3 |
5.2 |
13 |
3.3 |
78 |
0.0 |
1020 |
1025 |
1023 |
0.7 |
13.5 |
Sunny all day |
|
20 |
4.7 |
21.9 |
13.3 |
43 |
89 |
66 |
1.6 |
9.3 |
5.5 |
10 |
1.1 |
27 |
0.0 |
1025 |
1028 |
1026 |
0.4 |
7.1 |
Sunny intervals all day |
|
21 |
4.2 |
19.6 |
11.9 |
49 |
88 |
69 |
0.9 |
9.0 |
5.0 |
17 |
3.1 |
75 |
0.0 |
1027 |
1029 |
1028 |
0.2 |
11.0 |
Sunny all day |
|
22 |
6.2 |
17.7 |
12.0 |
61 |
90 |
76 |
3.0 |
9.9 |
6.5 |
13 |
2.2 |
54 |
0.0 |
1024 |
1029 |
1027 |
1.7 |
6.0 |
Sunny intervals all day |
|
23 |
6.9 |
16.4 |
11.7 |
62 |
90 |
76 |
4.1 |
8.5 |
6.3 |
15 |
2.6 |
62 |
0.0 |
1018 |
1024 |
1021 |
3.1 |
8.5 |
Sunny intervals all day |
|
24 |
10.6 |
16.6 |
13.6 |
57 |
82 |
70 |
4.3 |
7.7 |
6.0 |
24 |
6.4 |
154 |
0.0 |
1006 |
1018 |
1012 |
6.1 |
4.5 |
Sunny intervals all day |
|
25 |
6.7 |
13.6 |
10.2 |
58 |
87 |
73 |
3.9 |
8.4 |
6.2 |
34 |
10.1 |
242 |
7.2 |
1001 |
1007 |
1004 |
5.3 |
9.0 |
Sunny intervals all day |
|
26 |
8.7 |
14.7 |
11.7 |
63 |
86 |
75 |
4.1 |
7.4 |
5.8 |
25 |
6.9 |
165 |
1.2 |
1005 |
1007 |
1006 |
4.8 |
2.8 |
Brief sunny intervals all day |
|
27 |
7.7 |
12.6 |
10.2 |
63 |
91 |
77 |
3.5 |
7.1 |
5.3 |
24 |
4.0 |
96 |
11.0 |
995 |
1005 |
1000 |
4.7 |
4.3 |
Rain am, showers pm |
|
28 |
1.1 |
17.9 |
9.5 |
45 |
90 |
68 |
-1.7 |
6.4 |
2.4 |
14 |
2.1 |
51 |
0.0 |
997 |
1004 |
1000 |
-1.7 |
10.3 |
Sunny intervals all day |
|
29 |
3.0 |
14.9 |
9.0 |
61 |
89 |
75 |
-0.1 |
8.0 |
4.0 |
18 |
3.7 |
89 |
0.7 |
1004 |
1011 |
1007 |
0.2 |
4.8 |
Sunny intervals all day |
|
30 |
11.1 |
13.1 |
12.1 |
84 |
91 |
88 |
8.2 |
10.2 |
9.2 |
24 |
6.1 |
146 |
6.0 |
1010 |
1018 |
1014 |
9.6 |
0.4 |
Rain, int all day, fine evening |
|
|
6.0 |
16.1 |
11.1 |
58 |
89 |
73 |
2.5 |
8.2 |
5.3 |
19 |
3.9 |
2789 |
50.9 |
1009 |
1015 |
1012 |
2.7 |
184.48 |
|
|
|
Graphs for
April 2009 |
 |
|
Figure 1. Temperature and
Rainfall for April 2009. |
 |
|
Figure 2. Wind direction
for April 2009. |
 |
|
Figure 3.
Soil & sea surface temperature (SST) for Lyme Bay for April
2009. |
 |
|
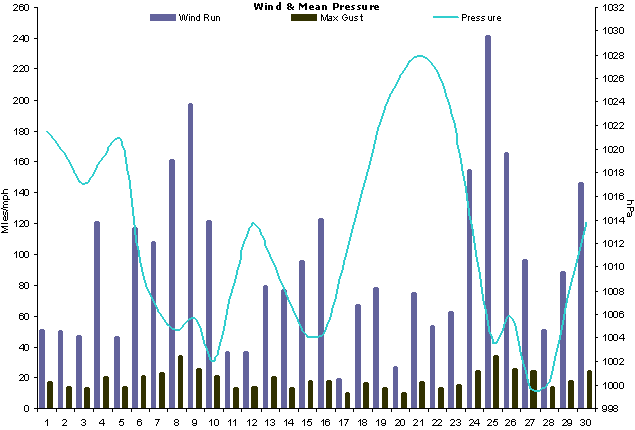
Figure 4.
Wind run, maximum
gusts and mean
pressure for April 2009. |