|
December 2009 |
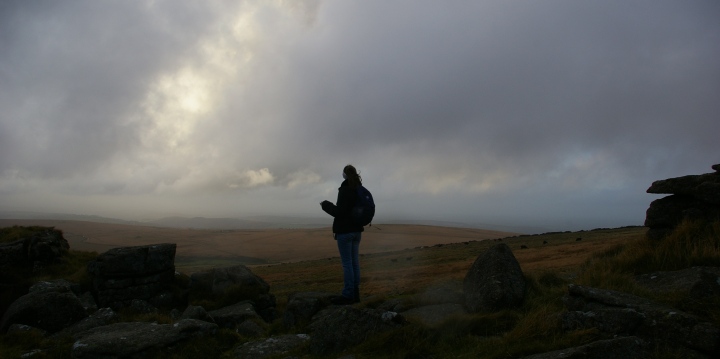
A Dartmoor December scene. Wild, moody
and mesmerising. |
|
Summary for |
December
2009 |
|
Mean Max: |
6.8ºC |
(-2.3ºC) |
|
Mean Min: |
0.8ºC |
(-2.7ºC) |
|
Mean: |
3.8ºC |
(-2.5ºC) |
|
|
|
|
|
High Max: |
12.1ºC |
9th |
|
Low Max: |
1.2ºC |
18th |
|
High Min: |
7.2ºC |
6th |
|
Low Min: |
-7.2ºC |
19th |
|
Mean Grass Min: |
-3.3ºC |
|
|
Grass Min: |
-10.3ºC |
19th |
|
|
|
|
|
Rain Total (gauge): |
86.3 mm |
(89%) |
|
Rain Total (tipping bucket): |
73.2 mm |
(76%) |
|
Rain Days >0.2 mm: |
21 Days |
|
|
Rain Days >1.0 mm: |
17 Days |
|
|
Max 24 hrs: |
12.4 mm |
6th |
|
Days without any rain: |
10 |
|
|
|
|
|
|
Air Frost: |
12 Days |
|
|
Ground Frost: |
24 Days |
|
|
Snow Falling: |
0 Days |
|
|
Snow (50%) @ 9am: |
0 Days |
|
|
Thunder Heard: |
0 Days |
|
|
Hail <5 mm: |
0 Days |
|
|
Hail >5 mm: |
0 Days |
|
|
Fog @ 9am: |
0 Days |
|
|
|
|
|
|
Total Monthly Sunshine: |
98h:43m |
|
|
Total Monthly Sunshine: |
98.7 Hours |
|
|
Most Sunshine in a Day: |
07h:28m |
25th |
|
Average Daily Sunshine: |
03h:11m |
|
|
Sunless Days: |
6 Days |
|
|
Cloudless Days: |
4 Days |
|
|
Total Possible Sunshine: |
249h:24m |
|
|
Percentage of Total Sun: |
40% |
|
|
|
|
|
|
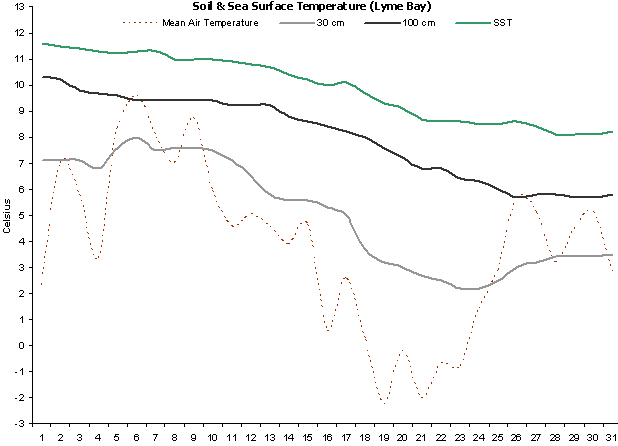
Mean Soil Temp @ 30 cm: |
5.2ºC |
|
|
Min Soil Temp @ 30 cm: |
2.2ºC |
23rd |
|
Max Soil Temp @ 30 cm: |
8.0ºC |
6th |
|
Mean Soil Temp @ 100 cm: |
8.1ºC |
|
|
Min Soil Temp @ 100 cm: |
5.7ºC |
29th |
|
Max Soil Temp @ 100 cm: |
10.3ºC |
1st |
|
|
|
|
|
Mean 10 Min Wind >39 mph: |
0.00 Days |
|
|
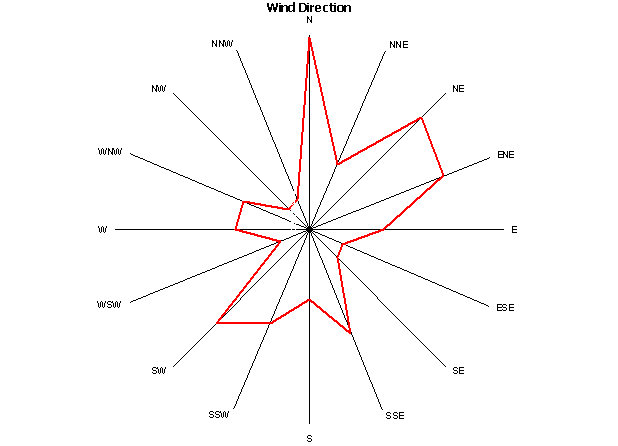
N: |
5.28 Days |
|
|
NE: |
6.07 Days |
|
|
E: |
2.19 Days |
|
|
SE: |
3.02 Days |
|
|
S: |
3.41 Days |
|
|
SW: |
3.26 Days |
|
|
W: |
2.94 Days |
|
|
NW: |
1.25 Days |
|
|
Calm: |
3.58 Days |
|
|
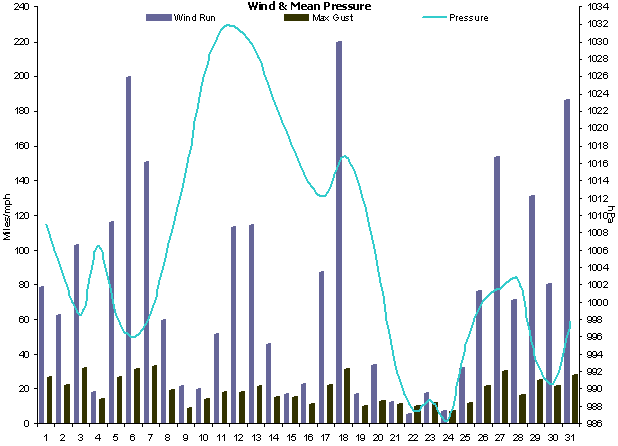
Mean Wind: |
3.1 mph |
|
|
Max Gust: |
33 mph |
7th |
|
|
|
|
|
Mean Cloud Cover: |
62% |
|
|
Mean RH @ 9am: |
89% |
|
|
Rain Duration >0.1mm/hour: |
51.3 Hours |
|
|
Frost Duration: |
127.3 Hours |
|
|
Max Frost Duration in a Day: |
18.0 Hours |
22nd |
|
|
|
|
|
Mean Sea Temperature: |
9.9ºC |
|
|
Normal for Month: |
|
|
|
Max Sea Temperature: |
11.6ºC |
1st |
|
Min Sea Temperature: |
8.1ºC |
28th |
|
|
|
|
|
Mean Pressure @ 9am: |
1007.7 hPa |
(-6.9 hPa) |
|
Mean Pressure: |
1006.1 hPa |
(-8.5 hPa) |
|
Max Pressure: |
1032.6 hPa |
12th |
|
Min Pressure: |
985.1 hPa |
22nd |
|
|
|
|
|
Max Dewpoint: |
10.7ºC |
9th |
|
Min Dewpoint: |
-9.4ºC |
19th |
|
Mean Dewpoint: |
1.4ºC |
|
|
|
|
|
|
Max Humidity: |
94% |
9th |
|
Min Humidity: |
70% |
18th |
|
Mean Humidity: |
87% |
(-0) |
|
|
A
cold, generally unsettled month though rather sunny at
times.
Night
time
and daytime temperatures were well below the average and
there were a very high number of air and ground frosts. |
|
Overall rainfall was
slightly below the long term average even though there
were a high number of days when rain actually fell. |
|
A
very unthundery month though this is not uncommon for
December. |
|
Sunshine
levels were above average even though there were 6 days
when the sun did not shine at all. |
|
Soil temperatures
were generally around normal though they ended up being
below normal during the final week. |
|
Winds were dominant from
the north & north-east sectors. |
|
There were 127 hours of
frost, this is the highest recorded monthly number of
hours in over 5 years. |
|
Sea temperatures gradually
fell through the month and ended up slightly below
average. |
|
Mean pressure was below
normal and indicative of the generally unsettled nature
of this month. |
|
Dewpoints were well below normal for most of the month. |
|
Despite the cold, dry air,
the RH ended up being around average. |
|
|
|
Weather Data for Otter Valley, Devon. |
December 2009 |
|
|
|
Temp (oC) |
Hum (RH%) |
Dewpoint (oC) |
Wind (mph) |
Rain |
Pressure (hPa) |
Grass |
Sun |
|
|
|
Min |
Max |
Ave |
Min |
Max |
Ave |
Min |
Max |
Ave |
Max |
Ave |
Run |
mm |
Min |
Max |
Ave |
Min |
Hours |
Observations |
|
1 |
-3.2 |
7.8 |
2.3 |
73 |
91 |
82 |
-5.1 |
6.1 |
0.5 |
27 |
3.3 |
79 |
2.6 |
1003 |
1015 |
1009 |
-3.6 |
0.2 |
Sunny ints am, cloudy pm |
|
2 |
4.4 |
9.6 |
7.0 |
90 |
92 |
91 |
2.7 |
7.8 |
5.3 |
22 |
2.6 |
63 |
3.7 |
991 |
1015 |
1003 |
-0.6 |
0.8 |
Showers all day |
|
3 |
4.1 |
7.5 |
5.8 |
73 |
92 |
83 |
-1.0 |
5.9 |
2.5 |
32 |
4.3 |
103 |
2.0 |
992 |
1005 |
999 |
-1.8 |
3.3 |
Showers all day |
|
4 |
-2.9 |
9.6 |
3.4 |
85 |
93 |
89 |
-4.7 |
8.1 |
1.7 |
14 |
0.8 |
18 |
1.7 |
1002 |
1011 |
1006 |
-6.4 |
0.3 |
Frosty am, drizzle pm |
|
5 |
5.1 |
11.6 |
8.4 |
87 |
93 |
90 |
3.1 |
9.8 |
6.5 |
27 |
4.8 |
116 |
3.3 |
995 |
1002 |
998 |
0.1 |
0.6 |
Sunny ints am, cloudy pm |
|
6 |
7.2 |
12.0 |
9.6 |
72 |
93 |
83 |
3.3 |
10.5 |
6.9 |
31 |
8.3 |
199 |
12.4 |
989 |
1003 |
996 |
2.5 |
4.9 |
Sunny intervals all day |
|
7 |
5.9 |
10.2 |
8.1 |
80 |
89 |
85 |
2.7 |
7.7 |
5.2 |
33 |
6.3 |
151 |
5.7 |
995 |
1003 |
999 |
-2.3 |
1.3 |
Showers am, sunny ints pm |
|
8 |
2.1 |
11.9 |
7.0 |
83 |
93 |
88 |
0.1 |
10.3 |
5.2 |
19 |
2.5 |
59 |
6.1 |
1002 |
1011 |
1007 |
-2.7 |
0.0 |
Rain, intermittent all day |
|
9 |
5.4 |
12.1 |
8.8 |
92 |
94 |
93 |
3.9 |
10.7 |
7.3 |
9 |
0.9 |
22 |
0.0 |
1011 |
1020 |
1015 |
0.5 |
2.7 |
Sunny intervals all day |
|
10 |
2.3 |
9.6 |
6.0 |
91 |
93 |
92 |
0.7 |
8.0 |
4.4 |
14 |
0.8 |
20 |
1.1 |
1020 |
1032 |
1026 |
-2.1 |
5.8 |
Sunny intervals all day |
|
11 |
2.2 |
7.0 |
4.6 |
87 |
92 |
90 |
0.4 |
5.0 |
2.7 |
18 |
2.1 |
51 |
0.0 |
1031 |
1032 |
1031 |
-2.6 |
3.9 |
Sunny intervals all day |
|
12 |
2.8 |
7.3 |
5.1 |
82 |
92 |
87 |
0.9 |
4.5 |
2.7 |
18 |
4.7 |
114 |
0.0 |
1030 |
1033 |
1031 |
-1.9 |
7.2 |
Sunny all day |
|
13 |
2.6 |
6.6 |
4.6 |
80 |
90 |
85 |
0.6 |
3.2 |
1.9 |
21 |
4.8 |
114 |
0.0 |
1026 |
1031 |
1029 |
-1.9 |
6.8 |
Sunny intervals all day |
|
14 |
2.2 |
5.6 |
3.9 |
86 |
89 |
88 |
0.2 |
3.4 |
1.8 |
15 |
1.9 |
46 |
0.0 |
1021 |
1026 |
1023 |
-0.6 |
0.0 |
Dull all day |
|
15 |
2.2 |
7.1 |
4.7 |
89 |
92 |
91 |
0.2 |
4.2 |
2.2 |
15 |
0.7 |
17 |
0.2 |
1016 |
1021 |
1018 |
-5.2 |
0.0 |
Dull am, drizzle pm |
|
16 |
-2.2 |
3.4 |
0.6 |
88 |
91 |
90 |
-4.0 |
1.4 |
-1.3 |
11 |
1.0 |
23 |
0.0 |
1010 |
1018 |
1014 |
-3.3 |
1.7 |
Sunny intervals all day |
|
17 |
0.1 |
5.1 |
2.6 |
72 |
92 |
82 |
-4.4 |
2.9 |
-0.8 |
22 |
3.6 |
87 |
1.1 |
1009 |
1016 |
1012 |
-4.2 |
7.2 |
Sunny all day |
|
18 |
-0.7 |
1.2 |
0.3 |
70 |
80 |
75 |
-5.2 |
-3.3 |
-4.3 |
31 |
9.1 |
220 |
0.0 |
1015 |
1019 |
1017 |
-10.3 |
6.6 |
Sunny intervals all day |
|
19 |
-7.2 |
2.7 |
-2.3 |
78 |
89 |
84 |
-9.4 |
-1.1 |
-5.3 |
10 |
0.7 |
17 |
0.0 |
1007 |
1019 |
1013 |
-8.3 |
6.1 |
Sunny intervals all day |
|
20 |
-4.1 |
3.7 |
-0.2 |
74 |
91 |
83 |
-6.1 |
0.0 |
-3.1 |
13 |
1.3 |
34 |
4.1 |
1000 |
1007 |
1004 |
-9.2 |
6.8 |
Sunny intervals all day |
|
21 |
-5.5 |
1.4 |
-2.1 |
84 |
89 |
87 |
-7.7 |
-0.8 |
-4.3 |
11 |
0.5 |
13 |
0.4 |
985 |
1000 |
993 |
-9.1 |
0.0 |
Cloudy am, rain pm |
|
22 |
-5.6 |
4.2 |
-0.7 |
88 |
92 |
90 |
-7.4 |
2.1 |
-2.7 |
10 |
0.2 |
5 |
0.0 |
985 |
990 |
988 |
-9.2 |
6.8 |
Sunny all day |
|
23 |
-5.7 |
4.1 |
-0.8 |
89 |
92 |
91 |
-7.3 |
2.6 |
-2.4 |
12 |
0.7 |
18 |
7.0 |
986 |
991 |
989 |
-6.4 |
0.7 |
Rain am, showers pm |
|
24 |
-1.4 |
4.2 |
1.4 |
91 |
93 |
92 |
-2.9 |
2.8 |
-0.1 |
7 |
0.3 |
7 |
2.0 |
985 |
988 |
987 |
-6.9 |
0.3 |
Brief sunny intervals all day |
|
25 |
-0.4 |
6.2 |
2.9 |
91 |
93 |
92 |
-4.3 |
4.6 |
0.2 |
12 |
1.3 |
32 |
0.2 |
988 |
1002 |
995 |
-1.8 |
7.5 |
Sunny all day |
|
26 |
2.8 |
8.5 |
5.7 |
86 |
92 |
89 |
0.9 |
6.5 |
3.7 |
21 |
3.2 |
76 |
2.6 |
999 |
1002 |
1000 |
-1.5 |
5.3 |
Sunny am, showers pm |
|
27 |
2.9 |
7.3 |
5.1 |
71 |
89 |
80 |
-1.9 |
3.3 |
0.7 |
30 |
6.4 |
154 |
1.1 |
997 |
1006 |
1002 |
-5.4 |
6.5 |
Sunny intervals all day |
|
28 |
-0.4 |
6.8 |
3.2 |
81 |
91 |
86 |
-3.0 |
3.5 |
0.3 |
16 |
3.0 |
71 |
0.7 |
998 |
1007 |
1003 |
0.8 |
5.5 |
Sunny intervals all day |
|
29 |
3.6 |
5.3 |
4.5 |
86 |
91 |
89 |
1.8 |
3.0 |
2.4 |
25 |
5.4 |
131 |
10.9 |
989 |
998 |
993 |
2.4 |
0.0 |
Rain, intermittent all day |
|
30 |
4.2 |
6.1 |
5.2 |
90 |
92 |
91 |
2.4 |
4.4 |
3.4 |
21 |
3.3 |
80 |
4.4 |
988 |
994 |
991 |
0.0 |
0.0 |
Drizzle am, cloudy pm |
|
31 |
1.4 |
4.3 |
2.9 |
79 |
90 |
85 |
-1.6 |
2.3 |
0.4 |
28 |
7.7 |
186 |
0.0 |
994 |
1002 |
998 |
0.0 |
0.1 |
Sunny ints am, cloudy pm |
|
|
0.8 |
6.8 |
3.8 |
83 |
91 |
87 |
-1.7 |
4.6 |
1.4 |
19 |
3.1 |
2322 |
73.2 |
1002 |
1010 |
1006 |
-3.5 |
98.7 |
|
|
|
Graphs for
December 2009 |
 |
|
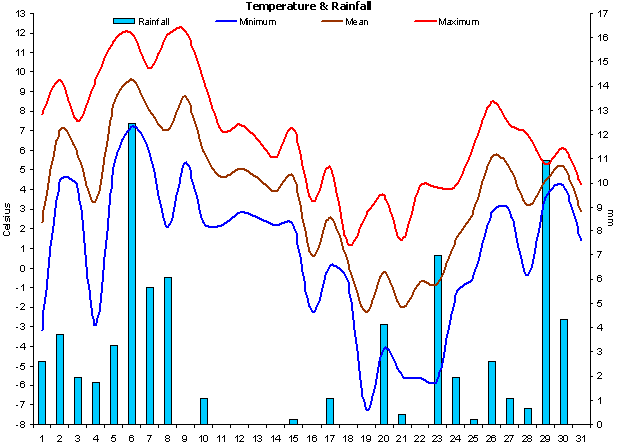
Figure 1. Temperature and
Rainfall for December 2009. |
 |
|
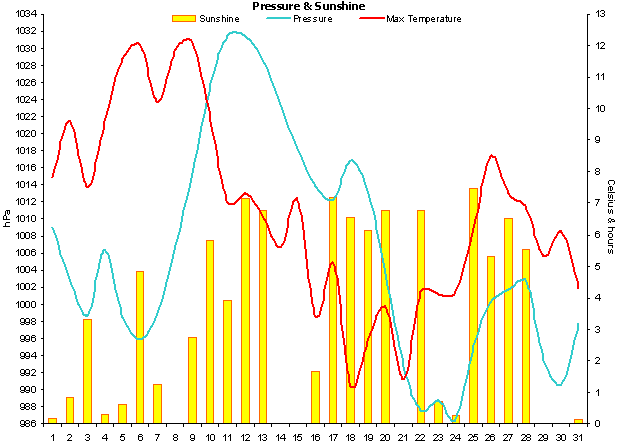
Figure 2. Sunshine, air
pressure and mean wind speed for December 2009. |
 |
|
Figure 3.
Wind direction for December 2009. |
 |
|
Figure 4. Soil & sea
surface temperature (SST) for Lyme Bay for December 2009. |
 |
|
Figure 5.
Wind run, maximum
gusts and mean
pressure for December 2009. |
|