|
February 2009 |
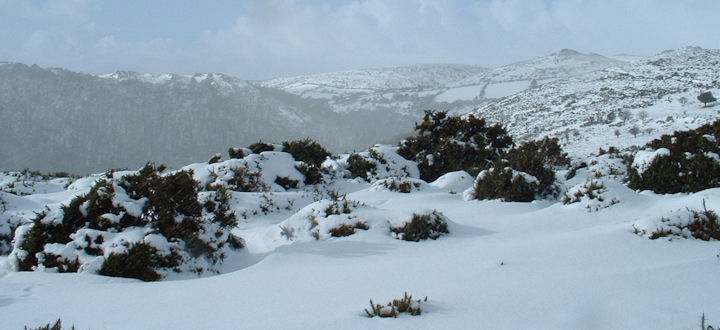
Dartmoor snow in early February. |
|
Summary for |
February
2009 |
|
Mean Max: |
8.7ºC |
(+0.1ºC) |
|
Mean Min: |
2.9ºC |
(+0.1ºC) |
|
Mean: |
5.8ºC |
(+0.1ºC) |
|
|
|
|
|
High Max: |
14.3ºC |
23rd |
|
Low Max: |
1.9ºC |
2nd |
|
High Min: |
8.2ºC |
27th |
|
Low Min: |
-3.6ºC |
3rd |
|
Mean Grass Min: |
0.3ºC |
|
|
Grass Min: |
-5.2ºC |
2nd |
|
|
|
|
|
Rain Total (gauge): |
0.0 mm |
(0%) |
|
Rain Total (tipping bucket): |
53.6 mm |
(70%) |
|
Rain Days >0.2 mm: |
10 Days |
|
|
Rain Days >1.0 mm: |
9 Days |
|
|
Max 24 hrs: |
20.9 mm |
9th |
|
Days without any rain: |
18 |
|
|
|
|
|
|
Air Frost: |
6 Days |
|
|
Ground Frost: |
11 Days |
|
|
Snow Falling: |
3 Days |
|
|
Snow (50%) @ 9am: |
2 Days |
|
|
Thunder Heard: |
0 Days |
|
|
Hail <5 mm: |
1 Days |
|
|
Hail >5 mm: |
0 Days |
|
|
Fog @ 9am: |
1 Days |
|
|
|
|
|
|
Total Monthly Sunshine: |
68h:48m |
|
|
Total Monthly Sunshine: |
68.8 Hours |
|
|
Most Sunshine in a Day: |
08h:13m |
7th |
|
Average Daily Sunshine: |
02h:27m |
|
|
Sunless Days: |
6 Days |
|
|
Cloudless Days: |
1 Days |
|
|
Total Possible Sunshine: |
281h:45m |
|
|
Percentage of Total Sun: |
24% |
|
|
|
|
|
|
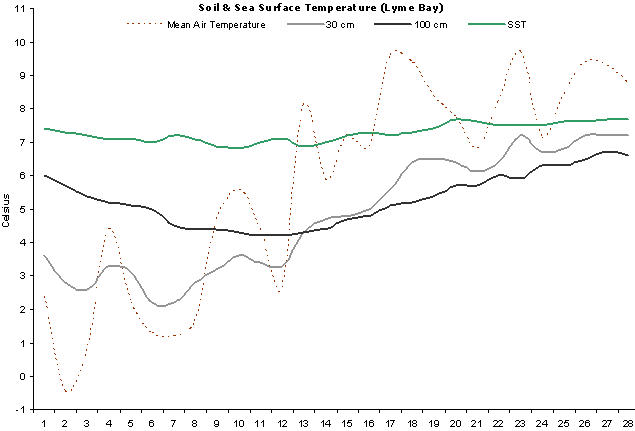
Mean Soil Temp @ 30 cm: |
4.8ºC |
|
|
Min Soil Temp @ 30 cm: |
2.2ºC |
6th |
|
Max Soil Temp @ 30 cm: |
7.2ºC |
23rd |
|
Mean Soil Temp @ 100 cm: |
5.3ºC |
|
|
Min Soil Temp @ 100 cm: |
4.2ºC |
11th |
|
Max Soil Temp @ 100 cm: |
6.7ºC |
27th |
|
|
|
|
|
Mean 10 Min Wind >39 mph: |
0.1 Days |
|
|
N: |
3.29 Days |
|
|
NE: |
2.86 Days |
|
|
E: |
2.01 Days |
|
|
SE: |
2.46 Days |
|
|
S: |
0.74 Days |
|
|
SW: |
2.08 Days |
|
|
W: |
8.00 Days |
|
|
NW: |
3.05 Days |
|
|
Calm: |
8.91 Days |
|
|
Mean Wind: |
3.5 mph |
|
|
Max Gust: |
33 mph |
6th |
|
|
|
|
|
Mean Cloud Cover: |
67% |
|
|
Mean RH @ 9am: |
87% |
|
|
Rain Duration >0.1mm/hour: |
39.8 Hours |
|
|
Frost Duration: |
67.3 Hours |
|
|
Max Frost Duration in a Day: |
19.3 Hours |
2nd |
|
|
|
|
|
Mean Sea Temperature: |
7.3ºC |
|
|
Normal for Month: |
|
|
|
Max Sea Temperature: |
7.7ºC |
20th |
|
Min Sea Temperature: |
6.8ºC |
10th |
|
|
|
|
|
Mean Pressure @ 9am: |
1016.0 hPa |
(+0.9 hPa) |
|
Mean Pressure: |
1015.4 hPa |
(+0.3 hPa) |
|
Max Pressure: |
1034.3 hPa |
21st |
|
Min Pressure: |
978.0 hPa |
9th |
|
|
|
|
|
Max Dewpoint: |
7.9ºC |
22nd |
|
Min Dewpoint: |
-7.8ºC |
1st |
|
Mean Dewpoint: |
1.9ºC |
|
|
|
|
|
|
Max Humidity: |
92% |
9th |
|
Min Humidity: |
57% |
1st |
|
Mean Humidity: |
80% |
(-4) |
|
|
A wet and cold start
with some snowfall, then settled, dry and much warmer.
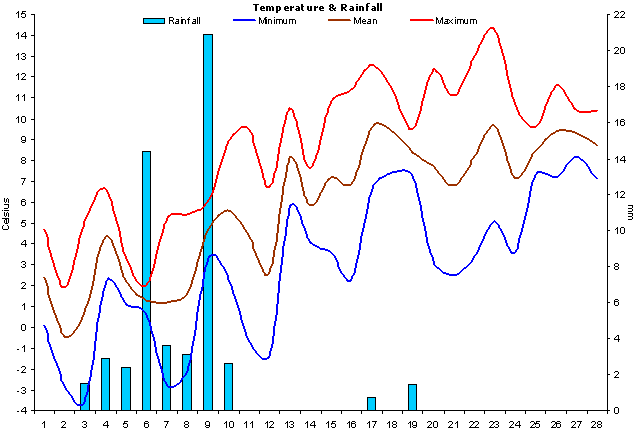
The sustained 'warmth'
from the 13th onwards is noteworthy with a mean minimum
temperature of 5.3°C (+2.5°C) and no air frosts. Mean
maximum temperature for the same period was 11.1°C
(+2.5°C). The coldest February since 2006 and the first
lying snow recorded since November 25th 2005. |
|
Only 2.1 mm of rain fell
from the 11th - 28th and was typical of a winter that
was dominated by short, very wet periods followed by
long, dry spells. |
|
This month was quite
frosty but not exceptionally so, and there was rather a high number of grass
frosts. |
|
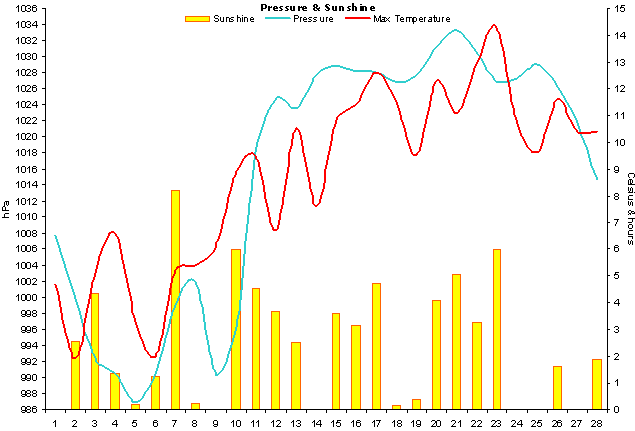
Sunshine levels were below
average and there were quite a lot of days
without any sunshine whatsoever. |
|
Soil temperatures
were generally below normal but recovered towards the
end of the month. |
|
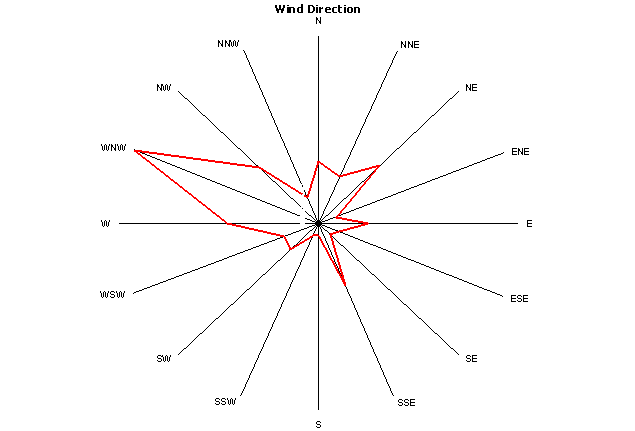
Winds dominated from the
west, north-west and north sectors. |
|
There were 6 air frosts
which amounted to a total time of just over 67 hours with
temperatures below 0°C. |
|
Sea temperatures gradually
rose from about mid-month onwards. |
|
Mean pressure was +0.3 hPa
above normal. |
|
Dewpoints were significantly
low at times during the first week of the month. |
|
This cold, dry air at
the beginning of the month meant relative humidity ended up
being below normal. |
|
|
|
Weather Data for Otter Valley, Devon. |
February 2009 |
|
|
|
Temp (oC) |
Hum (RH%) |
Dewpoint (oC) |
Wind (mph) |
Rain |
Pressure (hPa) |
Grass |
Sun |
|
|
|
Min |
Max |
Ave |
Min |
Max |
Ave |
Min |
Max |
Ave |
Max |
Ave |
Run |
mm |
Min |
Max |
Ave |
Min |
Hours |
Observations |
|
1 |
0.1 |
4.7 |
2.4 |
57 |
82 |
70 |
-7.8 |
1.5 |
-3.2 |
28 |
7.8 |
186 |
0.0 |
1006 |
1009 |
1008 |
-4.4 |
0.0 |
Bright all day, cold wind |
|
2 |
-2.8 |
1.9 |
-0.5 |
67 |
85 |
76 |
-7.0 |
-3.0 |
-5.0 |
24 |
7.0 |
169 |
0.0 |
993 |
1007 |
1000 |
-5.2 |
2.5 |
Sun am, snow showers pm |
|
3 |
-3.6 |
5.1 |
0.8 |
69 |
90 |
80 |
-6.5 |
0.9 |
-2.8 |
22 |
3.3 |
78 |
1.5 |
991 |
994 |
993 |
-3.3 |
4.3 |
Sun am, rain, snow pm |
|
4 |
2.2 |
6.6 |
4.4 |
61 |
89 |
75 |
-3.0 |
2.0 |
-0.5 |
31 |
7.1 |
171 |
2.9 |
987 |
994 |
991 |
-1.9 |
1.4 |
Sunshine & showers |
|
5 |
1.1 |
3.3 |
2.2 |
84 |
89 |
87 |
-1.5 |
0.9 |
-0.3 |
23 |
6.3 |
151 |
2.4 |
985 |
989 |
987 |
0.2 |
0.2 |
Sunny ints am, cloudy pm |
|
6 |
0.6 |
2.0 |
1.3 |
76 |
90 |
83 |
-3.1 |
-0.4 |
-1.8 |
33 |
10.5 |
251 |
14.4 |
987 |
995 |
991 |
-0.1 |
1.3 |
Snow am, sunny ints pm |
|
7 |
-2.8 |
5.2 |
1.2 |
71 |
89 |
80 |
-5.6 |
1.3 |
-2.2 |
20 |
3.6 |
87 |
3.6 |
995 |
1003 |
999 |
-3.1 |
8.2 |
Sunny all day |
|
8 |
-2.1 |
5.4 |
1.7 |
85 |
91 |
88 |
-4.9 |
3.5 |
-0.7 |
16 |
1.7 |
42 |
3.1 |
1000 |
1004 |
1002 |
-3.3 |
0.2 |
Brief sunny ints am, rain pm |
|
9 |
3.3 |
6.1 |
4.7 |
89 |
92 |
91 |
0.4 |
4.4 |
2.4 |
23 |
4.2 |
100 |
20.9 |
978 |
1003 |
990 |
1.0 |
0.0 |
Rain all day |
|
10 |
2.3 |
8.9 |
5.6 |
64 |
90 |
77 |
-0.9 |
3.4 |
1.3 |
28 |
9.6 |
231 |
2.6 |
978 |
1014 |
996 |
0.4 |
6.0 |
Sunny intervals all day |
|
11 |
-0.7 |
9.5 |
4.4 |
71 |
92 |
82 |
-2.8 |
6.9 |
2.1 |
14 |
1.2 |
30 |
0.0 |
1014 |
1022 |
1018 |
-3.2 |
4.5 |
Fog am, sunny ints pm |
|
12 |
-1.4 |
6.7 |
2.7 |
57 |
89 |
73 |
-4.0 |
1.9 |
-1.1 |
14 |
1.3 |
31 |
0.0 |
1022 |
1028 |
1025 |
-4.4 |
3.7 |
Sunny intervals all day |
|
13 |
5.7 |
10.5 |
8.1 |
79 |
90 |
85 |
1.9 |
6.6 |
4.3 |
14 |
3.3 |
80 |
0.0 |
1022 |
1026 |
1024 |
1.5 |
2.5 |
Sunny am, cloudy pm |
|
14 |
4.1 |
7.6 |
5.9 |
66 |
84 |
75 |
0.0 |
2.1 |
1.1 |
8 |
0.7 |
16 |
0.0 |
1026 |
1030 |
1028 |
2.2 |
0.0 |
Cloudy all day |
|
15 |
3.6 |
10.8 |
7.2 |
70 |
88 |
79 |
0.2 |
6.1 |
3.2 |
12 |
1.2 |
28 |
0.0 |
1028 |
1030 |
1029 |
0.7 |
3.6 |
Sunny intervals all day |
|
16 |
2.3 |
11.4 |
6.9 |
72 |
91 |
82 |
-0.7 |
6.8 |
3.1 |
14 |
1.8 |
43 |
0.0 |
1028 |
1029 |
1028 |
-1.5 |
3.1 |
Sunny intervals all day |
|
17 |
6.6 |
12.6 |
9.6 |
64 |
89 |
77 |
3.5 |
6.1 |
4.8 |
20 |
3.1 |
76 |
0.7 |
1027 |
1029 |
1028 |
2.5 |
4.7 |
Sunny intervals all day |
|
18 |
7.4 |
11.4 |
9.4 |
81 |
88 |
85 |
4.4 |
7.5 |
6.0 |
8 |
1.6 |
39 |
0.0 |
1025 |
1028 |
1027 |
5.1 |
0.2 |
Cloudy all day |
|
19 |
7.3 |
9.5 |
8.4 |
82 |
90 |
86 |
4.0 |
7.0 |
5.5 |
9 |
0.9 |
21 |
1.4 |
1026 |
1030 |
1028 |
5.4 |
0.4 |
Drizzle am, bright pm |
|
20 |
3.2 |
12.3 |
7.8 |
69 |
91 |
80 |
-0.1 |
7.3 |
3.6 |
8 |
0.8 |
18 |
0.0 |
1029 |
1033 |
1031 |
-0.1 |
4.1 |
Sunny intervals all day |
|
21 |
2.5 |
11.1 |
6.8 |
73 |
91 |
82 |
0.0 |
6.2 |
3.1 |
20 |
3.6 |
86 |
0.0 |
1032 |
1034 |
1033 |
0.6 |
5.1 |
Sunny intervals all day |
|
22 |
3.4 |
13.0 |
8.2 |
67 |
91 |
79 |
0.4 |
7.9 |
4.2 |
27 |
5.4 |
131 |
0.0 |
1028 |
1033 |
1030 |
0.2 |
3.3 |
Sunny intervals all day |
|
23 |
5.1 |
14.3 |
9.7 |
61 |
88 |
75 |
1.6 |
7.0 |
4.3 |
14 |
2.2 |
52 |
0.0 |
1025 |
1029 |
1027 |
1.7 |
6.0 |
Sunny intervals all day |
|
24 |
3.6 |
10.7 |
7.2 |
75 |
90 |
83 |
0.4 |
7.4 |
3.9 |
6 |
0.2 |
4 |
0.0 |
1026 |
1029 |
1027 |
0.7 |
0.0 |
Cloudy all day |
|
25 |
7.3 |
9.6 |
8.5 |
77 |
85 |
81 |
3.9 |
5.5 |
4.7 |
11 |
1.2 |
30 |
0.0 |
1028 |
1030 |
1029 |
5.6 |
0.0 |
Cloudy all day |
|
26 |
7.2 |
11.6 |
9.4 |
64 |
86 |
75 |
2.6 |
5.3 |
4.0 |
19 |
3.7 |
88 |
0.0 |
1024 |
1029 |
1026 |
4.7 |
1.6 |
Sunny intervals all day |
|
27 |
8.2 |
10.4 |
9.3 |
74 |
88 |
81 |
4.3 |
6.2 |
5.3 |
16 |
3.7 |
88 |
0.0 |
1020 |
1024 |
1022 |
5.1 |
0.0 |
Cloudy all day |
|
28 |
7.1 |
10.4 |
8.8 |
65 |
84 |
75 |
1.9 |
4.5 |
3.2 |
16 |
2.1 |
45 |
0.0 |
1010 |
1020 |
1015 |
2.6 |
1.9 |
Brief sunny intervals all day |
|
|
2.9 |
8.7 |
5.8 |
71 |
89 |
80 |
-0.7 |
4.4 |
1.9 |
18 |
3.5 |
2371 |
53.6 |
1012 |
1019 |
1015 |
0.3 |
68.8 |
|
|
|
Graphs for
February 2009 |
 |
|
Figure 1. Temperature and
Rainfall for February 2009. |
 |
|
Figure 2. Sunshine, air
pressure and mean wind speed for February 2009. |
 |
|
Figure 3.
Wind direction for February 2009. |
 |
|
Figure 4. Soil & sea surface
temperature (SST) for Lyme Bay for February 2009. |
 |
|
Figure 5.
Wind run, maximum
gusts and mean
pressure for February 2009. |
| |
|