|
July 2009 |
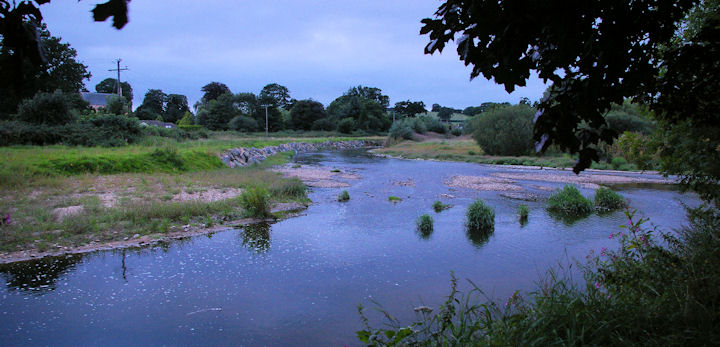
The River Otter at Tipton St John at the
end of a warm, cloudy and humid July day. |
|
Summary for |
July
2009 |
|
Mean Max: |
20.0ºC |
(-1.5ºC) |
|
Mean Min: |
12.7ºC |
(+0.4ºC) |
|
Mean: |
16.4ºC |
(-0.5ºC) |
|
|
|
|
|
High Max: |
28.0ºC |
1st |
|
Low Max: |
16.2ºC |
29th |
|
High Min: |
17.2ºC |
2nd |
|
Low Min: |
8.7ºC |
20th |
|
Mean Grass Min: |
9.1ºC |
|
|
Grass Min: |
5.4ºC |
20th |
|
|
|
|
|
Rain Total (gauge): |
142.7 mm |
(351%) |
|
Rain Total (tipping bucket): |
142.1 mm |
(349%) |
|
Rain Days >0.2 mm: |
24 Days |
|
|
Rain Days >1.0 mm: |
19 Days |
|
|
Max 24 hrs: |
28.3 mm |
29th |
|
Days without any rain: |
7 |
|
|
|
|
|
|
Air Frost: |
0 Days |
|
|
Ground Frost: |
0 Days |
|
|
Snow Falling: |
0 Days |
|
|
Snow (50%) @ 9am: |
0 Days |
|
|
Thunder Heard: |
0 Days |
|
|
Hail <5 mm: |
0 Days |
|
|
Hail >5 mm: |
0 Days |
|
|
Fog @ 9am: |
0 Days |
|
|
|
|
|
|
Total Monthly Sunshine: |
147h:21m |
|
|
Total Monthly Sunshine: |
147.2 Hours |
|
|
Most Sunshine in a Day: |
10h:05m |
30th |
|
Average Daily Sunshine: |
04h:45m |
|
|
Sunless Days: |
0 Days |
|
|
Cloudless Days: |
0 Days |
|
|
Total Possible Sunshine: |
508h:51m |
|
|
Percentage of Total Sun: |
29% |
|
|
|
|
|
|
Mean Soil Temp @ 30 cm: |
13.4ºC |
|
|
Min Soil Temp @ 30 cm: |
|
|
|
Max Soil Temp @ 30 cm: |
20.2ºC |
24th |
|
Mean Soil Temp @ 100 cm: |
10.8ºC |
|
|
Min Soil Temp @ 100 cm: |
|
|
|
Max Soil Temp @ 100 cm: |
17.3ºC |
24th |
|
|
|
|
|
Mean 10 Min Wind >39 mph: |
0.0 Days |
|
|
N: |
0.02 Days |
|
|
NE: |
0.59 Days |
|
|
E: |
1.74 Days |
|
|
SE: |
8.92 Days |
|
|
S: |
5.65 Days |
|
|
SW: |
5.40 Days |
|
|
W: |
6.66 Days |
|
|
NW: |
0.50 Days |
|
|
Calm: |
1.53 Days |
|
|
Mean Wind: |
4.3 mph |
|
|
Max Gust: |
34 mph |
17th |
|
|
|
|
|
Mean Cloud Cover: |
63% |
|
|
Mean RH @ 9am: |
81% |
|
|
Rain Duration >0.1mm/hour: |
67.8 Hours |
|
|
Frost Duration: |
0.0 Hours |
|
|
Max Frost Duration in a Day: |
0.0 Hours |
|
|
|
|
|
|
Mean Sea Temperature: |
16.8ºC |
|
|
Normal for Month: |
|
|
|
Max Sea Temperature: |
19.2ºC |
1st |
|
Min Sea Temperature: |
15.6ºC |
11th |
|
|
|
|
|
Mean Pressure @ 9am: |
1011.9 hPa |
(-5.3 hPa) |
|
Mean Pressure: |
1012.6 hPa |
(-4.6 hPa) |
|
Max Pressure: |
1024.0 hPa |
30th |
|
Min Pressure: |
1000.6 hPa |
22nd |
|
|
|
|
|
Max Dewpoint: |
17.5ºC |
16th |
|
Min Dewpoint: |
6.2ºC |
20th |
|
Mean Dewpoint: |
11.8ºC |
|
|
|
|
|
|
Max Humidity: |
98% |
21st |
|
Min Humidity: |
41% |
1st |
|
Mean Humidity: |
77% |
(+1) |
|
|
A
dull, very wet month and also it was quite windy at
times. Often cool but with a few warmer days as well,
especially at the beginning.
The
first month since March to break the dry, sunny and
warmer than average theme. Colder than July 2008, warmer
than July 2007 but duller and much wetter than either. |
|
Exceptionally wet with an
anomaly of 350%, this was the highest monthly rainfall
anomaly recorded since the station was set up in May
2005 with rain falling on 24 out of the 31 days. |
|
Unusually
for July there were no thunderstorms. |
|
Easily
the dullest month of this spring/summer period so far
with only 147 hours of sunshine. Just 29% of the
available sunshine is the lowest recorded for any month
since this weather was set up in Spring 2005. |
|
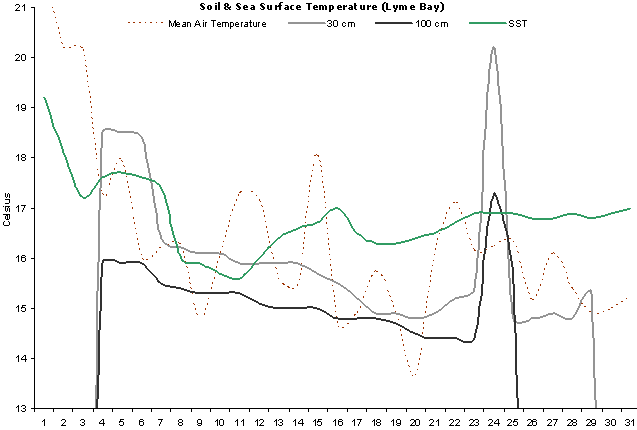
Soil temperatures
were generally above normal throughout. |
|
Winds were dominant from
the west and south-east directions. |
|
Very high cloud cover and
no days of unbroken sunshine. |
|
Sea temperatures were at
their highest at the beginning and fell gradually
through the rest of the month. |
|
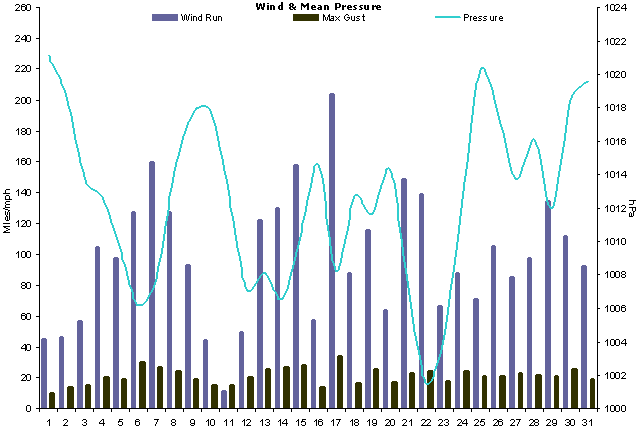
Mean pressure was just
-4.6 hPa
below normal and indicative of this very unsettled month. |
|
Dewpoints were significantly
low through most of the month. |
|
With it being a very wet
and cool month, the RH was only just above the long-term
average. |
|
|
|
Weather Data for Otter Valley, Devon. |
July 2009 |
|
|
|
Temp (oC) |
Hum (RH%) |
Dewpoint (oC) |
Wind (mph) |
Rain |
Pressure (hPa) |
Grass |
Sun |
|
|
|
Min |
Max |
Ave |
Min |
Max |
Ave |
Min |
Max |
Ave |
Max |
Ave |
Run |
mm |
Min |
Max |
Ave |
Min |
Hours |
Observations |
|
1 |
15.7 |
28.0 |
21.9 |
41 |
87 |
64 |
10.0 |
16.2 |
13.1 |
10 |
1.9 |
45 |
0.0 |
1020 |
1022 |
1021 |
0.0 |
5.5 |
Sunny intervals all day |
|
2 |
17.2 |
23.2 |
20.2 |
52 |
86 |
69 |
10.3 |
17.2 |
13.8 |
14 |
1.9 |
46 |
0.0 |
1015 |
1022 |
1019 |
0.0 |
5.5 |
Sunny ints am, cloudy pm |
|
3 |
16.0 |
24.3 |
20.2 |
53 |
90 |
72 |
12.3 |
15.6 |
14.0 |
15 |
2.4 |
57 |
4.6 |
1013 |
1015 |
1014 |
0.0 |
5.5 |
Sunny intervals all day |
|
4 |
13.2 |
21.4 |
17.3 |
64 |
89 |
77 |
10.1 |
15.5 |
12.8 |
20 |
4.4 |
105 |
0.0 |
1011 |
1015 |
1013 |
10.8 |
5.5 |
|
|
5 |
14.8 |
21.1 |
18.0 |
59 |
88 |
74 |
11.4 |
13.6 |
12.5 |
19 |
4.1 |
98 |
2.8 |
1008 |
1011 |
1009 |
11.5 |
5.5 |
|
|
6 |
12.9 |
19.1 |
16.0 |
62 |
88 |
75 |
10.4 |
14.0 |
12.2 |
30 |
5.3 |
127 |
5.9 |
1004 |
1008 |
1006 |
10.8 |
5.5 |
|
|
7 |
13.1 |
19.3 |
16.2 |
69 |
91 |
80 |
11.0 |
13.8 |
12.4 |
27 |
6.7 |
160 |
13.1 |
1005 |
1011 |
1008 |
12.4 |
5.5 |
|
|
8 |
13.4 |
19.1 |
16.3 |
56 |
88 |
72 |
8.7 |
11.7 |
10.2 |
24 |
5.3 |
127 |
0.2 |
1011 |
1017 |
1014 |
9.2 |
5.5 |
|
|
9 |
10.2 |
19.4 |
14.8 |
53 |
88 |
71 |
6.7 |
12.2 |
9.5 |
19 |
3.9 |
93 |
0.0 |
1017 |
1018 |
1018 |
8.2 |
5.5 |
|
|
10 |
11.2 |
20.8 |
16.0 |
53 |
84 |
69 |
6.7 |
12.7 |
9.7 |
15 |
1.9 |
45 |
0.4 |
1017 |
1019 |
1018 |
8.4 |
5.5 |
Sunny ints am, cloudy pm |
|
11 |
14.3 |
20.3 |
17.3 |
79 |
92 |
86 |
11.6 |
16.2 |
13.9 |
15 |
3.0 |
11 |
8.7 |
1009 |
1017 |
1013 |
13.9 |
5.5 |
Sunny intervals am, rain pm |
|
12 |
13.3 |
21.0 |
17.2 |
59 |
92 |
76 |
10.9 |
13.7 |
12.3 |
20 |
4.8 |
50 |
8.7 |
1005 |
1009 |
1007 |
12.3 |
3.5 |
Sunny intervals all day |
|
13 |
10.8 |
20.4 |
15.6 |
69 |
91 |
80 |
8.1 |
14.0 |
11.1 |
25 |
5.1 |
122 |
0.7 |
1006 |
1010 |
1008 |
7.5 |
6.9 |
Sun & light showers all day |
|
14 |
11.9 |
19.0 |
15.5 |
73 |
91 |
82 |
9.8 |
14.0 |
11.9 |
27 |
5.4 |
130 |
1.5 |
1005 |
1008 |
1007 |
8.2 |
1.8 |
Sunshine & showers all day |
|
15 |
14.4 |
21.7 |
18.1 |
61 |
89 |
75 |
11.3 |
14.9 |
13.1 |
28 |
6.6 |
157 |
3.5 |
1004 |
1017 |
1011 |
12.3 |
6.1 |
Showers am, sunny ints pm |
|
16 |
10.9 |
18.4 |
14.7 |
75 |
90 |
83 |
8.3 |
17.5 |
12.9 |
14 |
2.4 |
57 |
13.7 |
1010 |
1020 |
1015 |
7.8 |
0.3 |
Sunny ints am, then rain |
|
17 |
12.1 |
17.7 |
14.9 |
75 |
91 |
83 |
9.8 |
12.5 |
11.2 |
34 |
8.5 |
204 |
6.5 |
1004 |
1013 |
1008 |
10.8 |
2.3 |
Rain am, brief sunny ints pm |
|
18 |
12.6 |
18.9 |
15.8 |
63 |
89 |
76 |
10.1 |
14.3 |
12.2 |
16 |
3.7 |
88 |
1.1 |
1011 |
1014 |
1013 |
10.5 |
0.7 |
Sunny ints am, drizzle pm |
|
19 |
12.3 |
17.5 |
14.9 |
70 |
88 |
79 |
10.1 |
12.9 |
11.5 |
26 |
4.8 |
115 |
6.1 |
1011 |
1013 |
1012 |
10.1 |
5.4 |
Sunshine & showers all day |
|
20 |
8.7 |
18.6 |
13.7 |
64 |
91 |
78 |
6.2 |
11.9 |
9.1 |
17 |
2.7 |
64 |
0.0 |
1012 |
1016 |
1014 |
5.4 |
3.9 |
Sunny ints am, cloudy pm |
|
21 |
14.3 |
17.8 |
16.1 |
81 |
93 |
87 |
11.4 |
15.5 |
13.5 |
23 |
6.2 |
149 |
16.8 |
1002 |
1013 |
1007 |
13.2 |
1.8 |
Rain am, drizzle pm |
|
22 |
13.8 |
20.4 |
17.1 |
62 |
90 |
76 |
10.1 |
13.3 |
11.7 |
24 |
5.8 |
139 |
0.0 |
1001 |
1002 |
1002 |
11.2 |
4.1 |
Cloudy am, sunny ints pm |
|
23 |
11.2 |
21.1 |
16.2 |
58 |
91 |
75 |
9.2 |
13.0 |
11.1 |
18 |
2.8 |
66 |
1.1 |
1001 |
1008 |
1004 |
8.0 |
6.6 |
Sun & light showers pm |
|
24 |
12.1 |
20.4 |
16.3 |
60 |
91 |
76 |
9.8 |
12.8 |
11.3 |
24 |
3.7 |
88 |
3.1 |
1008 |
1017 |
1013 |
8.4 |
8.5 |
Sun & showers, fine evening |
|
25 |
11.4 |
21.3 |
16.4 |
59 |
91 |
75 |
8.7 |
13.8 |
11.3 |
21 |
3.0 |
71 |
0.2 |
1017 |
1023 |
1020 |
9.2 |
9.5 |
Sunny intervals all day |
|
26 |
13.2 |
17.1 |
15.2 |
76 |
91 |
84 |
10.0 |
13.7 |
11.9 |
21 |
4.4 |
106 |
10.9 |
1013 |
1022 |
1018 |
10.2 |
0.3 |
Cloudy am, rain pm |
|
27 |
11.6 |
20.6 |
16.1 |
53 |
92 |
73 |
8.8 |
13.3 |
11.1 |
23 |
3.5 |
85 |
4.1 |
1011 |
1016 |
1014 |
11.7 |
7.7 |
Sunny intervals all day |
|
28 |
11.2 |
19.6 |
15.4 |
67 |
90 |
79 |
8.2 |
13.3 |
10.8 |
22 |
4.1 |
97 |
0.0 |
1015 |
1017 |
1016 |
8.1 |
3.5 |
Sunny intervals all day |
|
29 |
13.6 |
16.2 |
14.9 |
82 |
92 |
87 |
10.9 |
14.0 |
12.5 |
21 |
5.6 |
135 |
27.0 |
1009 |
1015 |
1012 |
13.1 |
0.7 |
Rain all day, fine evening |
|
30 |
10.9 |
19.1 |
15.0 |
55 |
91 |
73 |
8.5 |
12.0 |
10.3 |
25 |
4.7 |
112 |
1.3 |
1013 |
1024 |
1018 |
8.6 |
10.1 |
Sunny intervals all day |
|
31 |
11.9 |
18.6 |
15.3 |
61 |
87 |
74 |
8.6 |
12.4 |
10.5 |
19 |
3.8 |
93 |
0.7 |
1015 |
1024 |
1020 |
11.2 |
3.6 |
Sunny ints am, cloudy pm |
|
|
12.7 |
20.0 |
16.4 |
63 |
90 |
77 |
9.6 |
13.9 |
11.8 |
21 |
4.3 |
3039 |
142.1 |
1010 |
1015 |
1013 |
10.1 |
147.23 |
|
|
|
Graphs for
July 2009 |
 |
|
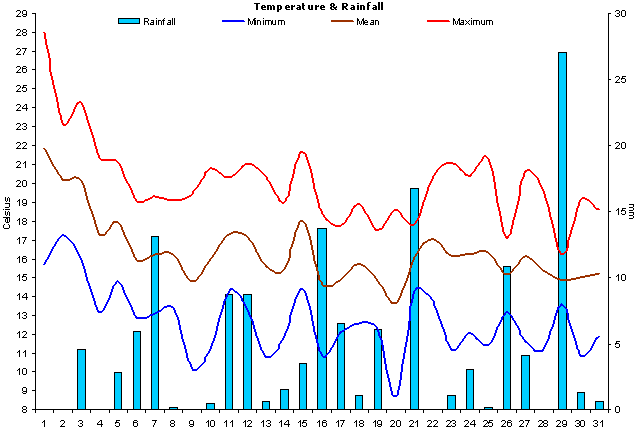
Figure 1. Temperature and
Rainfall for July 2009. |
 |
|
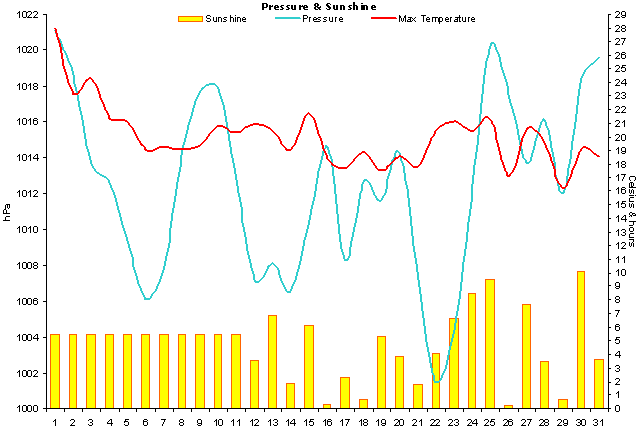
Figure 2. Sunshine, air
pressure and mean wind speed for July 2009. Note that sunshine
for the first 11 days was averaged over that period as no
observations were made and only a total was calculated. |
 |
|
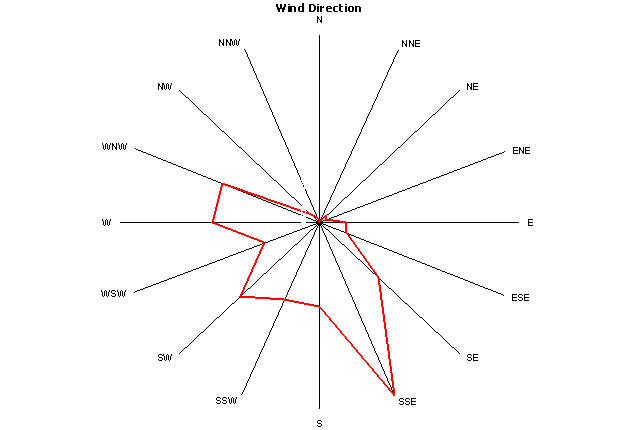
Figure 3.
Wind direction for July 2009. |
 |
|
Figure 4. Soil & sea
surface temperature (SST) for Lyme Bay for July 2009. Ignore the
spikes for the 24th as this was an error in the data. |
 |
|
Figure 5.
Wind run, maximum
gusts and mean
pressure for July 2009. |
|