|
Summary for |
December
2010 |
|
Mean Max: |
3.7ºC |
(-5.4ºC) |
|
Mean Min: |
-2.3ºC |
(-5.8ºC) |
|
Mean: |
0.7ºC |
(-5.6ºC) |
|
|
|
|
|
High Max: |
10.6ºC |
28th |
|
Low Max: |
-1.4ºC |
25th |
|
High Min: |
8.1ºC |
29th |
|
Low Min: |
-11.6ºC |
26th |
|
Mean Grass Min: |
-3.8ºC |
|
|
Grass Min: |
-12.0ºC |
7th |
|
|
|
|
|
Rain Total (gauge): |
31.6 mm |
(33%) |
|
Rain Total (tipping bucket): |
20.7 mm |
(21%) |
|
Rain Days >0.2 mm: |
10 Days |
|
|
Rain Days >1.0 mm: |
5 Days |
|
|
Max 24 hrs: |
9.5 mm |
27th |
|
Days without any rain: |
21 |
|
|
|
|
|
|
Air Frost: |
21 Days |
|
|
Ground Frost: |
25 Days |
|
|
Snow Falling: |
2 Days |
|
|
Snow (50%) @ 9am: |
10 Days |
|
|
Thunder Heard: |
0 Days |
|
|
Hail <5 mm: |
0 Days |
|
|
Hail >5 mm: |
0 Days |
|
|
Fog @ 9am: |
3 Days |
|
|
|
|
|
|
Total Monthly Sunshine: |
91h:27m |
|
|
Total Monthly Sunshine: |
91.4 Hours |
|
|
Most Sunshine in a Day: |
07h:23m |
6th |
|
Average Daily Sunshine: |
02h:57m |
|
|
Sunless Days: |
9 Days |
|
|
Cloudless Days: |
10 Days |
|
|
Total Possible Sunshine: |
249h:24m |
|
|
Percentage of Total Sun: |
37% |
|
|
|
|
|
|
Mean Soil Temp @ 30 cm: |
2.6ºC |
|
|
Min Soil Temp @ 30 cm: |
1.4ºC |
27th |
|
Max Soil Temp @ 30 cm: |
4.2ºC |
30th |
|
Mean Soil Temp @ 100 cm: |
5.5ºC |
|
|
Min Soil Temp @ 100 cm: |
4.2ºC |
29th |
|
Max Soil Temp @ 100 cm: |
7.8ºC |
1st |
|
|
|
|
|
Mean 10 Min Wind >39 mph: |
0.00 Days |
|
|
N: |
7.98 Days |
|
|
NE: |
5.55 Days |
|
|
E: |
2.63 Days |
|
|
SE: |
2.67 Days |
|
|
S: |
0.67 Days |
|
|
SW: |
0.71 Days |
|
|
W: |
3.33 Days |
|
|
NW: |
4.95 Days |
|
|
Calm: |
2.52 Days |
|
|
Mean Wind: |
3.6 mph |
|
|
Max Gust: |
38 mph |
16th |
|
|
|
|
|
Mean Cloud Cover: |
75% |
|
|
Mean RH @ 9am: |
87% |
|
|
Rain Duration >0.1mm/hour: |
18.0 Hours |
|
|
Frost Duration: |
372.5 Hours |
|
|
Max Frost Duration in a Day: |
24.0 Hours |
7th |
|
|
|
|
|
Mean Sea Temperature: |
7.2ºC |
|
|
Normal for Month: |
|
|
|
Max Sea Temperature: |
9.4ºC |
1st |
|
Min Sea Temperature: |
5.4ºC |
27th |
|
|
|
|
|
Mean Pressure @ 9am: |
1014.6 hPa |
(-0.0 hPa) |
|
Mean Pressure: |
1014.8 hPa |
(+0.2 hPa) |
|
Max Pressure: |
1039.0 hPa |
15th |
|
Min Pressure: |
990.5 hPa |
18th |
|
|
|
|
|
Max Dewpoint: |
9.1ºC |
28th |
|
Min Dewpoint: |
-14.3ºC |
26th |
|
Mean Dewpoint: |
-2.3ºC |
|
|
|
|
|
|
Max Humidity: |
93% |
28th |
|
Min Humidity: |
63% |
1st |
|
Mean Humidity: |
85% |
(-2) |
|
|
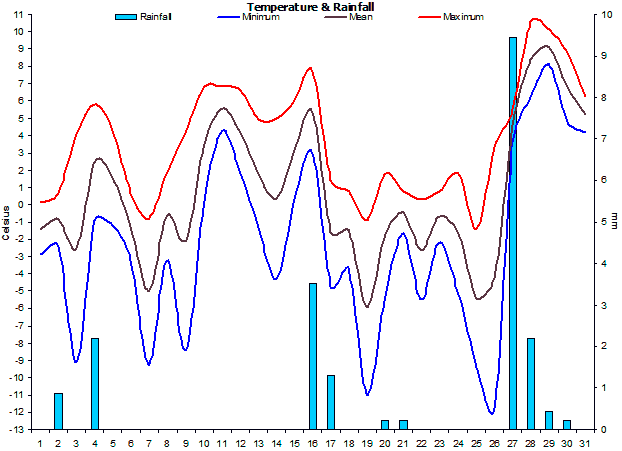
An extremely cold month throughout with frequent, severe
frosts and 10 days of snow lying.
Temperatures stayed well
below average until the last 5 days of the month. Frosts
were persistent and frequent with 3 days when the
temperature failed to get above freezing (ice-days).
There was 30 cm of level snow lying on the 20th. |
|
Precipitation was well
below average with only 33% of the normal expected. |
|
Frosts
were frequent and severe, on the 26th the temperature
went down to -11.6°C, this is the coldest temperature I
have ever recorded. |
|
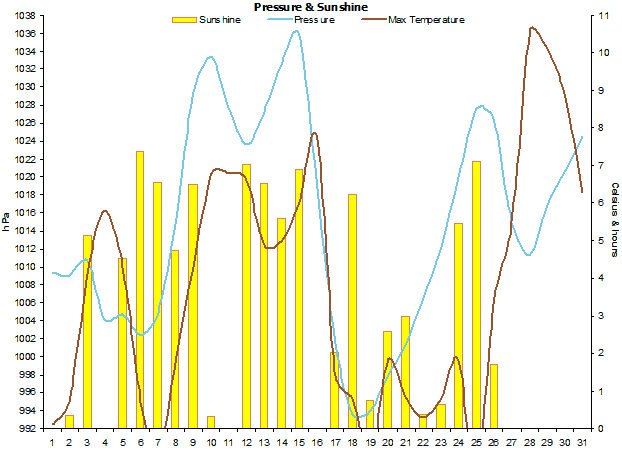
Sunshine
amounts were generally above normal though there were 5
consecutively cloudy days at the end of the month, this
is the longest 'dullest' period recorded for any month. |
|
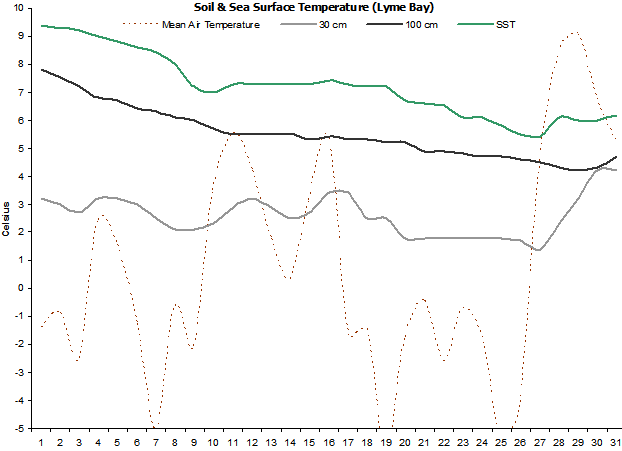
Soil temperatures were
well below normal through. |
|
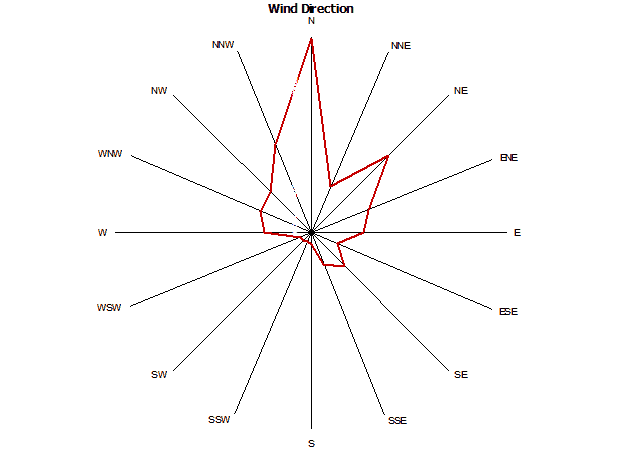
Winds were dominant from a
northerly direction with a near-complete absence of
southerly or south-westerly winds. |
|
Rainfall duration was only
18 hours and reflected in what was a very dry month
overall. |
|
Sea temperatures fell
sharply throughout the month and ended up being
extremely below average and almost historically cold. |
|
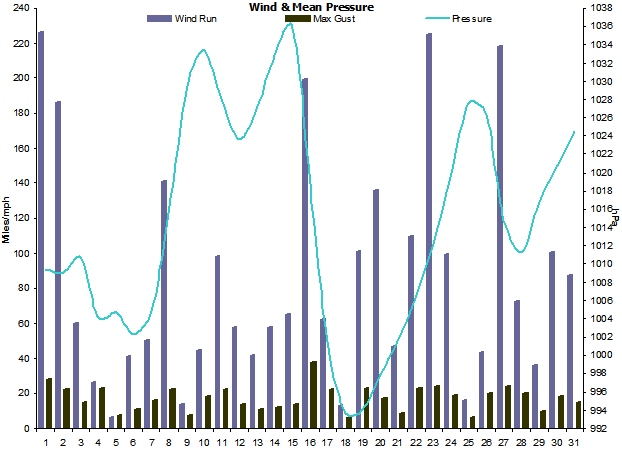
Mean pressure was around
average. |
|
Dewpoints were well below
average. |
|
The RH ended up being a
little below normal due to large incursions of very dry,
cold Arctic air. |
|
|
|
Weather Data for Otter Valley, Devon. |
December 2010 |
|
|
|
Temp (oC) |
Hum (RH%) |
Dewpoint (oC) |
Wind (mph) |
Rain |
Pressure (hPa) |
Grass |
Sun |
|
|
|
Min |
Max |
Ave |
Min |
Max |
Ave |
Min |
Max |
Ave |
Max |
Ave |
Run |
mm |
Min |
Max |
Ave |
Min |
Hours |
Observations |
|
1 |
-2.9 |
0.1 |
-1.4 |
63 |
81 |
72 |
-7.8 |
-3.8 |
-5.8 |
28 |
9.5 |
226 |
0.0 |
1008 |
1011 |
1009 |
-5.9 |
0.0 |
Cloudy all day |
|
2 |
-2.4 |
0.7 |
-0.9 |
73 |
87 |
80 |
-6.1 |
-2.9 |
-4.5 |
22 |
7.8 |
186 |
0.9 |
1007 |
1011 |
1009 |
-4.8 |
0.3 |
Brief sunny intervals all day |
|
3 |
-9.1 |
4.1 |
-2.5 |
77 |
89 |
83 |
-11.7 |
0.9 |
-5.4 |
15 |
2.5 |
60 |
0.0 |
1007 |
1015 |
1011 |
0.0 |
5.1 |
Sunny intervals all day |
|
4 |
-0.9 |
5.8 |
2.5 |
88 |
92 |
90 |
-2.9 |
4.0 |
0.6 |
23 |
1.1 |
27 |
2.2 |
1002 |
1007 |
1004 |
0.3 |
0.0 |
Rain, intermittent all day |
|
5 |
-1.2 |
4.3 |
1.6 |
90 |
92 |
91 |
-4.3 |
2.6 |
-0.9 |
7 |
0.3 |
6 |
0.0 |
1004 |
1006 |
1005 |
-7.9 |
4.5 |
Foggy am, sunny pm |
|
6 |
-3.2 |
0.7 |
-1.3 |
89 |
92 |
91 |
-8.6 |
-0.8 |
-4.7 |
11 |
1.7 |
41 |
0.0 |
1001 |
1004 |
1002 |
-10.8 |
7.4 |
Sunny all day |
|
7 |
-9.3 |
-0.8 |
-5.1 |
88 |
91 |
90 |
-11.2 |
-2.4 |
-6.8 |
16 |
2.1 |
50 |
0.0 |
1003 |
1007 |
1005 |
-12.0 |
6.5 |
Sunny all day |
|
8 |
-3.2 |
1.9 |
-0.7 |
72 |
91 |
82 |
-6.4 |
-2.1 |
-4.3 |
22 |
5.9 |
141 |
0.0 |
1007 |
1024 |
1015 |
-8.5 |
4.7 |
Sunny intervals all day |
|
9 |
-8.4 |
4.3 |
-2.1 |
82 |
91 |
87 |
-10.8 |
1.9 |
-4.5 |
7 |
0.6 |
14 |
0.0 |
1024 |
1035 |
1029 |
-10.8 |
6.5 |
Sunny all day |
|
10 |
0.2 |
6.8 |
3.5 |
83 |
92 |
88 |
-5.6 |
4.4 |
-0.6 |
18 |
1.8 |
44 |
0.0 |
1032 |
1035 |
1033 |
-7.2 |
0.3 |
Brief sunny intervals all day |
|
11 |
4.3 |
6.8 |
5.6 |
82 |
88 |
85 |
1.6 |
3.9 |
2.8 |
22 |
4.1 |
98 |
0.0 |
1024 |
1032 |
1028 |
0.9 |
0.0 |
Cloudy all day |
|
12 |
1.8 |
6.6 |
4.2 |
75 |
89 |
82 |
-3.9 |
2.7 |
-0.6 |
14 |
2.4 |
58 |
0.0 |
1022 |
1025 |
1024 |
-6.3 |
7.0 |
Sunny all day |
|
13 |
-1.3 |
4.9 |
1.8 |
81 |
91 |
86 |
-5.6 |
2.3 |
-1.7 |
11 |
1.8 |
42 |
0.0 |
1025 |
1029 |
1027 |
-7.5 |
6.5 |
Sunny all day |
|
14 |
-4.3 |
5.0 |
0.4 |
82 |
91 |
87 |
-6.5 |
1.9 |
-2.3 |
12 |
2.4 |
58 |
0.0 |
1029 |
1036 |
1033 |
-7.9 |
5.6 |
Sunny all day |
|
15 |
0.3 |
6.0 |
3.2 |
77 |
91 |
84 |
-2.6 |
2.1 |
-0.3 |
14 |
2.7 |
65 |
0.0 |
1033 |
1039 |
1036 |
-5.5 |
6.9 |
Sunny all day |
|
16 |
3.0 |
7.7 |
5.4 |
73 |
90 |
82 |
-2.7 |
5.2 |
1.3 |
38 |
8.3 |
199 |
3.5 |
1005 |
1033 |
1019 |
-1.5 |
0.0 |
Cloudy am, rain pm |
|
17 |
-4.7 |
1.4 |
-1.7 |
77 |
89 |
83 |
-7.6 |
-0.8 |
-4.2 |
22 |
2.6 |
62 |
1.3 |
997 |
1006 |
1002 |
-8.8 |
2.0 |
Heavy snow showers |
|
18 |
-3.7 |
0.8 |
-1.5 |
86 |
91 |
89 |
-11.0 |
-0.9 |
-6.0 |
6 |
0.5 |
13 |
0.0 |
991 |
997 |
994 |
-2.6 |
6.2 |
Sunny all day |
|
19 |
-11.0 |
-0.9 |
-6.0 |
82 |
90 |
86 |
-13.2 |
-3.5 |
-8.4 |
23 |
4.2 |
101 |
0.0 |
991 |
998 |
994 |
-2.8 |
0.7 |
Brief sunny ints pm |
|
20 |
-5.3 |
1.8 |
-1.8 |
83 |
90 |
87 |
-7.7 |
0.0 |
-3.9 |
17 |
5.2 |
136 |
0.2 |
997 |
999 |
998 |
-9.6 |
2.6 |
Sunny ints after early snow |
|
21 |
-1.7 |
0.8 |
-0.5 |
85 |
91 |
88 |
-5.4 |
-1.5 |
-3.5 |
9 |
1.9 |
47 |
0.2 |
998 |
1005 |
1002 |
-0.8 |
3.0 |
Sunny am, cloudy pm |
|
22 |
-5.5 |
0.3 |
-2.6 |
84 |
90 |
87 |
-7.5 |
-2.1 |
-4.8 |
23 |
4.6 |
110 |
0.0 |
1005 |
1009 |
1007 |
-1.4 |
0.4 |
Brief sunny ints am |
|
23 |
-2.2 |
0.8 |
-0.7 |
75 |
87 |
81 |
-4.9 |
-3.0 |
-4.0 |
24 |
9.4 |
225 |
0.0 |
1009 |
1016 |
1012 |
-1.2 |
0.6 |
Brief sunny ints am |
|
24 |
-5.2 |
1.8 |
-1.7 |
74 |
87 |
81 |
-8.4 |
-2.5 |
-5.5 |
19 |
4.5 |
100 |
0.0 |
1016 |
1024 |
1020 |
-1.4 |
5.5 |
Sunny all day |
|
25 |
-9.4 |
-1.4 |
-5.4 |
83 |
89 |
86 |
-11.9 |
-3.4 |
-7.7 |
6 |
0.7 |
16 |
0.0 |
1024 |
1031 |
1028 |
-2.9 |
7.1 |
Sunny all day |
|
26 |
-11.6 |
3.3 |
-4.3 |
74 |
91 |
83 |
-14.3 |
-0.3 |
-7.3 |
20 |
1.8 |
43 |
0.0 |
1021 |
1032 |
1026 |
-3.9 |
1.7 |
Sunny intervals all day |
|
27 |
3.6 |
5.5 |
4.6 |
70 |
91 |
81 |
-1.3 |
3.0 |
0.9 |
24 |
9.1 |
218 |
9.5 |
1009 |
1021 |
1015 |
-0.3 |
0.0 |
Cloudy all day |
|
28 |
6.2 |
10.6 |
8.4 |
91 |
93 |
92 |
3.2 |
9.1 |
6.2 |
20 |
3.0 |
73 |
2.2 |
1008 |
1015 |
1011 |
-0.3 |
0.0 |
Cloudy all day |
|
29 |
8.1 |
10.1 |
9.1 |
93 |
93 |
93 |
6.4 |
8.5 |
7.5 |
10 |
1.5 |
36 |
0.4 |
1015 |
1019 |
1017 |
5.5 |
0.0 |
Cloudy all day |
|
30 |
4.8 |
8.8 |
6.8 |
89 |
93 |
91 |
3.2 |
7.2 |
5.2 |
18 |
4.2 |
100 |
0.2 |
1019 |
1023 |
1021 |
7.1 |
0.0 |
Cloudy all day |
|
31 |
4.2 |
6.3 |
5.3 |
84 |
89 |
87 |
1.8 |
4.1 |
3.0 |
15 |
3.6 |
88 |
0.0 |
1023 |
1026 |
1025 |
2.4 |
0.0 |
Cloudy all day |
|
|
-2.3 |
3.7 |
0.7 |
81 |
90 |
85 |
-5.6 |
1.1 |
-2.3 |
17 |
3.6 |
2681 |
20.7 |
1011 |
1018 |
1015 |
-3.9 |
91.37 |
|
Graphs for
December 2010 |
 |
|
Figure 1. Temperature and
Rainfall for December 2010. |
 |
|
Figure 2. Sunshine, air
pressure and mean wind speed for December 2010. |
 |
|
Figure 3.
Wind direction for December 2010. |
 |
|
Figure 4. Soil & sea
surface temperature (SST) for Lyme Bay for December 2010. |
 |
|
Figure 5.
Wind run, maximum
gusts and mean
pressure for December 2010. |