|
Summary for |
October
2010 |
|
Mean Max: |
15.3ºC |
(+0.5ºC) |
|
Mean Min: |
7.3ºC |
(-0.4ºC) |
|
Mean: |
11.3ºC |
(+0.0ºC) |
|
|
|
|
|
High Max: |
22.3ºC |
8th |
|
Low Max: |
9.4ºC |
14th |
|
High Min: |
15.3ºC |
8th |
|
Low Min: |
-2.2ºC |
21st |
|
Mean Grass Min: |
4.2ºC |
|
|
Grass Min: |
-5.3ºC |
24th |
|
|
|
|
|
Rain Total (gauge): |
82.9 mm |
(133%) |
|
Rain Total (tipping bucket): |
68.9 mm |
(110%) |
|
Rain Days >0.2 mm: |
14 Days |
|
|
Rain Days >1.0 mm: |
11 Days |
|
|
Max 24 hrs: |
20.5 mm |
1st |
|
Days without any rain: |
17 |
|
|
|
|
|
|
Air Frost: |
2 Days |
|
|
Ground Frost: |
9 Days |
|
|
Snow Falling: |
0 Days |
|
|
Snow (50%) @ 9am: |
0 Days |
|
|
Thunder Heard: |
0 Days |
|
|
Hail <5 mm: |
0 Days |
|
|
Hail >5 mm: |
0 Days |
|
|
Fog @ 9am: |
0 Days |
|
|
|
|
|
|
Total Monthly Sunshine: |
163h:38m |
|
|
Total Monthly Sunshine: |
163.6 Hours |
|
|
Most Sunshine in a Day: |
10h:22m |
11th |
|
Average Daily Sunshine: |
05h:16m |
|
|
Sunless Days: |
1 Day |
|
|
Cloudless Days: |
4 Days |
|
|
Total Possible Sunshine: |
331h:48m |
|
|
Percentage of Total Sun: |
49% |
|
|
|
|
|
|
Mean Soil Temp @ 30 cm: |
11.8ºC |
|
|
Min Soil Temp @ 30 cm: |
9.1ºC |
25th |
|
Max Soil Temp @ 30 cm: |
13.8ºC |
8th |
|
Mean Soil Temp @ 100 cm: |
12.7ºC |
|
|
Min Soil Temp @ 100 cm: |
11.2ºC |
27th |
|
Max Soil Temp @ 100 cm: |
13.7ºC |
11th |
|
|
|
|
|
Mean 10 Min Wind >39 mph: |
0.00 Days |
|
|
N: |
4.86 Days |
|
|
NE: |
4.18 Days |
|
|
E: |
2.66 Days |
|
|
SE: |
4.66 Days |
|
|
S: |
4.55 Days |
|
|
SW: |
2.50 Days |
|
|
W: |
4.32 Days |
|
|
NW: |
3.17 Days |
|
|
Calm: |
0.10 Days |
|
|
Mean Wind: |
3.2 mph |
|
|
Max Gust: |
44 mph |
3rd |
|
|
|
|
|
Mean Cloud Cover: |
58% |
|
|
Mean RH @ 9am: |
89% |
|
|
Rain Duration >0.1mm/hour: |
46.0 Hours |
|
|
Frost Duration: |
15.0 Hours |
|
|
Max Frost Duration in a Day: |
8.0 Hours |
21st |
|
|
|
|
|
Mean Sea Temperature: |
15.0ºC |
|
|
Normal for Month: |
|
|
|
Max Sea Temperature: |
16.4ºC |
4th |
|
Min Sea Temperature: |
13.5ºC |
26th |
|
|
|
|
|
Mean Pressure @ 9am: |
1014.0 hPa |
(-0.4 hPa) |
|
Mean Pressure: |
1012.8 hPa |
(-1.6 hPa) |
|
Max Pressure: |
1030.4 hPa |
25th |
|
Min Pressure: |
988.5 hPa |
3rd |
|
|
|
|
|
Max Dewpoint: |
16.4ºC |
8th |
|
Min Dewpoint: |
-4.7ºC |
21st |
|
Mean Dewpoint: |
7.1ºC |
|
|
|
|
|
|
Max Humidity: |
93% |
1st |
|
Min Humidity: |
49% |
17th |
|
Mean Humidity: |
79% |
(-6) |
|
|
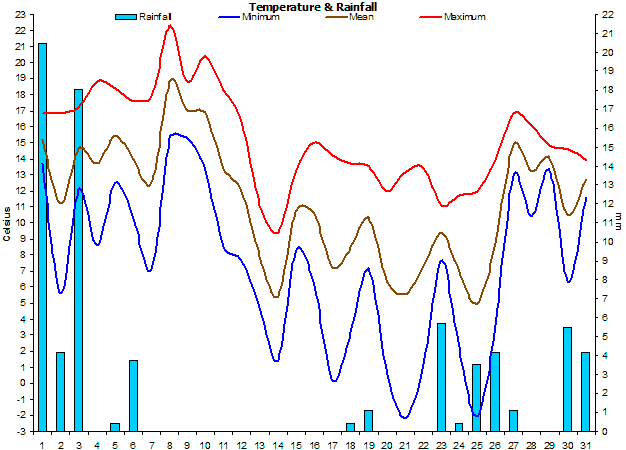
After
a wet start the month settled into spells of warm
sunshine though with some cold nights. Only at the end
did it turn unsettled again.
Temperatures were
above normal by day but due to a run of cold nights
during the 3rd week, the average minimum temperatures
ended up below average. |
|
There first week was very
wet but then there was very little rainfall from the 7th
to the 22nd. |
|
There
were a few very cold nights with air frosts, these being
quite a rarity in October. |
|
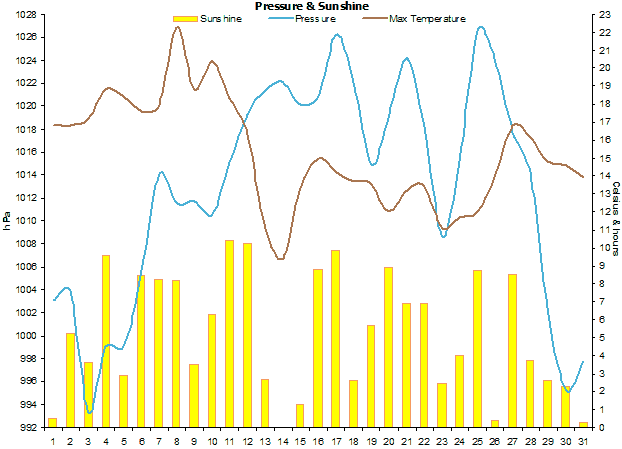
Sunshine
amounts were generally above normal with the sun being
fairly evenly spread throughout the month. |
|
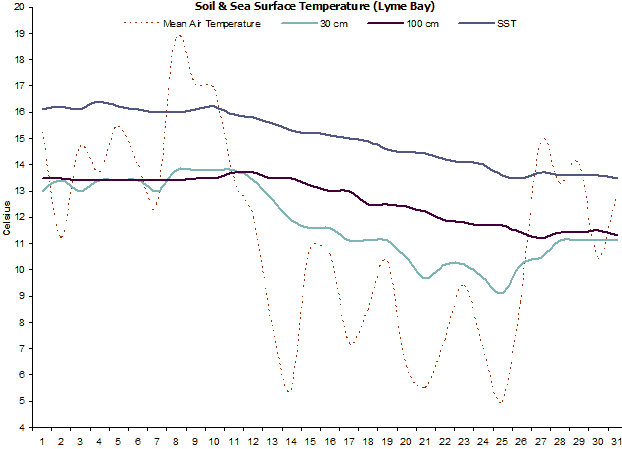
Soil temperatures were
around normal through most of the month but ended up
rather below average due to a few cold nights during the
3rd week. |
|
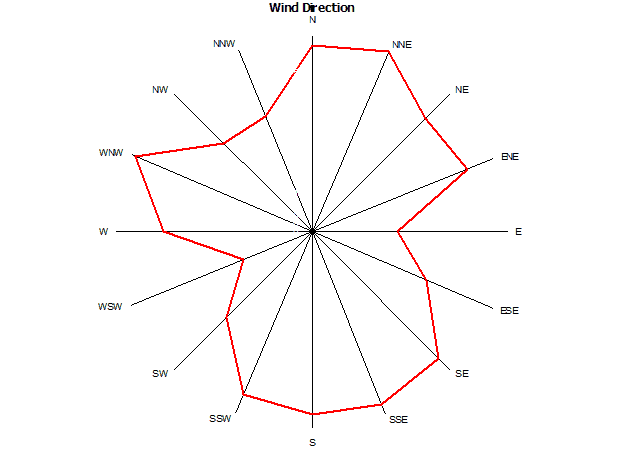
Winds were all over the
place though less so from the SW, which is usually the
dominant direction. |
|
Rainfall duration was 46.0 hours. |
|
Sea temperatures fell very
quickly throughout the month, mainly due to run of quite
cold nights. |
|
Mean pressure was below
average. |
|
Dewpoints were below
average. |
|
The RH ended up being
rather below normal. |
|
|
|
Weather Data for Otter Valley, Devon. |
October 2010 |
|
|
|
Temp (oC) |
Hum (RH%) |
Dewpoint (oC) |
Wind (mph) |
Rain |
Pressure (hPa) |
Grass |
Sun |
|
|
|
Min |
Max |
Ave |
Min |
Max |
Ave |
Min |
Max |
Ave |
Max |
Ave |
Run |
mm |
Min |
Max |
Ave |
Min |
Hours |
Observations |
|
1 |
13.7 |
16.8 |
15.3 |
88 |
93 |
91 |
9.7 |
15.2 |
12.5 |
34 |
7.7 |
0 |
20.5 |
996 |
1010 |
1003 |
8.2 |
0.5 |
Rain all day, bright evening |
|
2 |
5.6 |
16.8 |
11.2 |
70 |
93 |
82 |
3.8 |
13.3 |
8.6 |
15 |
1.0 |
0 |
4.2 |
998 |
1010 |
1004 |
3.8 |
5.3 |
Sunny intervals all day |
|
3 |
12.1 |
17.2 |
14.7 |
68 |
93 |
81 |
8.9 |
13.8 |
11.4 |
44 |
4.6 |
0 |
18.0 |
989 |
998 |
993 |
9.8 |
3.6 |
Cloudy am, sunny ints pm |
|
4 |
8.6 |
18.8 |
13.7 |
61 |
92 |
77 |
5.9 |
11.9 |
8.9 |
13 |
1.3 |
0 |
0.0 |
998 |
1001 |
999 |
5.7 |
9.6 |
Sunny all day |
|
5 |
12.5 |
18.4 |
15.5 |
70 |
92 |
81 |
10.0 |
13.8 |
11.9 |
18 |
2.7 |
0 |
0.4 |
997 |
1001 |
999 |
10.8 |
2.9 |
Sunny intervals all day |
|
6 |
10.3 |
17.6 |
14.0 |
53 |
91 |
72 |
7.1 |
12.5 |
9.8 |
20 |
3.4 |
0 |
3.7 |
999 |
1013 |
1006 |
4.5 |
8.5 |
Sunny intervals all day |
|
7 |
7.1 |
17.9 |
12.5 |
64 |
92 |
78 |
4.8 |
12.3 |
8.6 |
26 |
3.9 |
0 |
0.0 |
1012 |
1016 |
1014 |
11.5 |
8.2 |
Sunny intervals all day |
|
8 |
15.3 |
22.3 |
18.8 |
70 |
90 |
80 |
10.9 |
16.4 |
13.7 |
27 |
6.0 |
0 |
0.0 |
1010 |
1013 |
1012 |
12.5 |
8.2 |
Sunny intervals all day |
|
9 |
15.3 |
18.8 |
17.1 |
79 |
91 |
85 |
12.8 |
14.9 |
13.9 |
22 |
5.4 |
0 |
0.0 |
1010 |
1013 |
1012 |
11.5 |
3.5 |
Cloudy am, sunny ints pm |
|
10 |
13.3 |
20.4 |
16.9 |
70 |
90 |
80 |
9.4 |
14.6 |
12.0 |
21 |
5.0 |
0 |
0.0 |
1009 |
1012 |
1011 |
5.5 |
6.3 |
Cloudy am, sunny pm |
|
11 |
8.5 |
18.3 |
13.4 |
53 |
87 |
70 |
5.9 |
9.7 |
7.8 |
24 |
5.5 |
0 |
0.0 |
1012 |
1018 |
1015 |
3.8 |
10.4 |
Sunny all day |
|
12 |
7.7 |
16.3 |
12.0 |
62 |
87 |
75 |
4.8 |
9.3 |
7.1 |
19 |
4.8 |
0 |
0.0 |
1018 |
1021 |
1019 |
2.7 |
10.2 |
Sunny all day |
|
13 |
4.7 |
11.1 |
7.9 |
72 |
90 |
81 |
1.2 |
6.9 |
4.1 |
12 |
1.6 |
0 |
0.0 |
1020 |
1022 |
1021 |
-0.2 |
2.7 |
Cloudy am, sunny ints pm |
|
14 |
1.4 |
9.4 |
5.4 |
81 |
91 |
86 |
-1.2 |
6.0 |
2.4 |
10 |
0.7 |
0 |
0.0 |
1021 |
1023 |
1022 |
-0.2 |
0.0 |
Cloudy all day |
|
15 |
8.3 |
13.3 |
10.8 |
67 |
88 |
78 |
5.3 |
8.1 |
6.7 |
14 |
1.5 |
0 |
0.0 |
1018 |
1022 |
1020 |
2.3 |
1.3 |
Cloudy am, sunny ints pm |
|
16 |
6.1 |
15.0 |
10.6 |
62 |
89 |
76 |
3.1 |
7.8 |
5.5 |
16 |
2.4 |
0 |
0.0 |
1018 |
1024 |
1021 |
-1.3 |
8.8 |
Sunny intervals all day |
|
17 |
0.2 |
14.2 |
7.2 |
49 |
90 |
70 |
-2.2 |
5.6 |
1.7 |
9 |
0.5 |
0 |
0.0 |
1024 |
1028 |
1026 |
0.9 |
9.9 |
Sunny all day |
|
18 |
3.2 |
13.7 |
8.5 |
68 |
91 |
80 |
-0.1 |
10.4 |
5.2 |
14 |
1.6 |
0 |
0.4 |
1018 |
1026 |
1022 |
6.7 |
2.6 |
Sunny intervals all day |
|
19 |
7.1 |
13.5 |
10.3 |
64 |
89 |
77 |
4.0 |
8.4 |
6.2 |
24 |
5.3 |
0 |
1.1 |
1012 |
1018 |
1015 |
-0.8 |
5.7 |
Sunny intervals all day |
|
20 |
0.6 |
12.0 |
6.3 |
53 |
91 |
72 |
-1.8 |
4.5 |
1.4 |
14 |
1.4 |
0 |
0.0 |
1014 |
1025 |
1019 |
-3.1 |
8.9 |
Sunny intervals all day |
|
21 |
-2.2 |
13.2 |
5.5 |
61 |
91 |
76 |
-4.7 |
6.6 |
1.0 |
12 |
0.9 |
0 |
0.0 |
1022 |
1026 |
1024 |
-0.4 |
6.9 |
Sunny intervals all day |
|
22 |
1.2 |
13.4 |
7.3 |
65 |
91 |
78 |
-1.2 |
8.1 |
3.5 |
19 |
1.2 |
0 |
0.0 |
1014 |
1023 |
1018 |
4.2 |
6.9 |
Sunny intervals all day |
|
23 |
7.7 |
11.1 |
9.4 |
80 |
90 |
85 |
2.1 |
8.9 |
5.5 |
17 |
3.4 |
0 |
5.7 |
1004 |
1014 |
1009 |
-1.4 |
2.5 |
Sunshine & showers all day |
|
24 |
2.3 |
11.7 |
7.0 |
65 |
91 |
78 |
-0.3 |
5.4 |
2.6 |
17 |
1.8 |
0 |
0.4 |
1008 |
1022 |
1015 |
-5.3 |
4.0 |
Sunny intervals all day |
|
25 |
-2.1 |
12.0 |
5.0 |
55 |
91 |
73 |
-4.3 |
4.9 |
0.3 |
0 |
0.1 |
0 |
3.5 |
1023 |
1030 |
1027 |
-2.3 |
8.7 |
Sunny all day |
|
26 |
3.6 |
13.9 |
8.8 |
79 |
92 |
86 |
0.0 |
11.9 |
6.0 |
19 |
2.9 |
0 |
4.2 |
1020 |
1029 |
1024 |
7.1 |
0.4 |
Rain am, sunny ints pm |
|
27 |
12.9 |
16.8 |
14.9 |
64 |
91 |
78 |
5.8 |
11.5 |
8.7 |
19 |
3.3 |
0 |
1.1 |
1016 |
1020 |
1018 |
3.1 |
8.5 |
Sunny intervals all day |
|
28 |
10.4 |
16.1 |
13.3 |
76 |
91 |
84 |
5.7 |
11.7 |
8.7 |
19 |
2.7 |
0 |
0.0 |
1011 |
1017 |
1014 |
10.7 |
3.7 |
Sunny intervals all day |
|
29 |
13.3 |
14.8 |
14.1 |
74 |
89 |
82 |
7.0 |
11.7 |
9.4 |
26 |
8.5 |
0 |
0.0 |
992 |
1012 |
1002 |
1.1 |
2.6 |
Sunny intervals all day |
|
30 |
6.3 |
14.6 |
10.5 |
71 |
92 |
82 |
2.9 |
9.9 |
6.4 |
23 |
3.2 |
0 |
5.5 |
993 |
997 |
995 |
10.1 |
2.3 |
Sunny intervals all day |
|
31 |
11.6 |
13.9 |
12.8 |
80 |
90 |
85 |
8.1 |
11.1 |
9.6 |
23 |
6.1 |
0 |
4.2 |
992 |
1004 |
998 |
9.4 |
0.3 |
Brief sunny intervals all day |
|
|
7.3 |
15.3 |
11.3 |
68 |
91 |
79 |
4.1 |
10.2 |
7.1 |
20 |
3.2 |
0 |
68.9 |
1009 |
1016 |
1013 |
4.2 |
163.6 |
|
|
|
Graphs for
October 2010 |
 |
|
Figure 1. Temperature and
Rainfall for October 2010. |
 |
|
Figure 2. Sunshine, air
pressure and mean wind speed for October 2010. |
 |
|
Figure 3.
Wind direction for October 2010. |
 |
|
Figure 4. Soil & sea
surface temperature (SST) for Lyme Bay for October 2010. |