|
February 2010 |
|
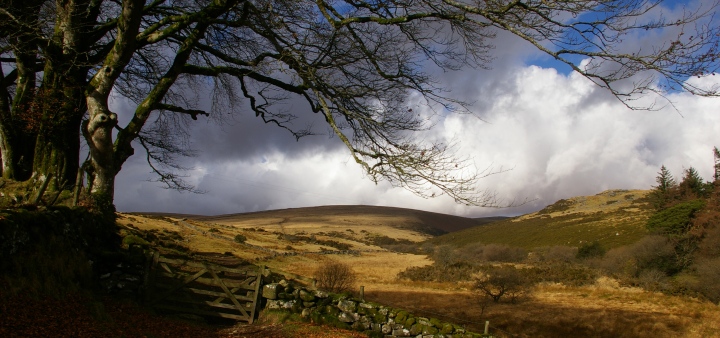
A dramatic Dartmoor sky on an inspiring
February day. |
|
Summary for |
February
2011 |
|
Mean Max: |
10.5ºC |
(+1.9ºC) |
|
Mean Min: |
5.3ºC |
(+2.5ºC) |
|
Mean: |
7.9ºC |
(+2.2ºC) |
|
|
|
|
|
High Max: |
14.3ºC |
24th |
|
Low Max: |
7.3ºC |
28th |
|
High Min: |
11.1ºC |
5th |
|
Low Min: |
-1.4ºC |
1st |
|
Mean Grass Min: |
3.0ºC |
|
|
Grass Min: |
-6.4ºC |
28th |
|
|
|
|
|
Rain Total (gauge): |
70.5 mm |
(92%) |
|
Rain Total (tipping bucket): |
68.6 mm |
(90%) |
|
Rain Days >0.2 mm: |
16 Days |
|
|
Rain Days >1.0 mm: |
13 Days |
|
|
Max 24 hrs: |
17.8 mm |
13th |
|
Days without any rain: |
12 |
|
|
|
|
|
|
Air Frost: |
2 Days |
|
|
Ground Frost: |
10 Days |
|
|
Snow Falling: |
0 Days |
|
|
Snow (50%) @ 9am: |
0 Days |
|
|
Thunder Heard: |
0 Days |
|
|
Hail <5 mm: |
2 Days |
|
|
Hail >5 mm: |
0 Days |
|
|
Fog @ 9am: |
0 Days |
|
|
|
|
|
|
Total Monthly Sunshine: |
52h:27m |
|
|
Total Monthly Sunshine: |
53.4 Hours |
(66%) |
|
Most Sunshine in a Day: |
5.8 Hours |
19th |
|
Average Daily Sunshine: |
1.9 Hours |
|
|
Sunless Days: |
6 Days |
|
|
Cloudless Days: |
1 Days |
|
|
Total Possible Sunshine: |
280h:55m |
|
|
Percentage of Total Sun: |
19% |
|
|
Maximum UV Index: |
3 |
26th |
|
Average UV Index: |
1.1 |
|
|
|
|
|
|
Mean Soil Temp @ 30 cm: |
6.2ºC |
|
|
Min Soil Temp @ 30 cm: |
2.5ºC |
1st |
|
Max Soil Temp @ 30 cm: |
8.3ºC |
26th |
|
Mean Soil Temp @ 100 cm: |
6.4ºC |
|
|
Min Soil Temp @ 100 cm: |
4.7ºC |
2nd |
|
Max Soil Temp @ 100 cm: |
7.7ºC |
27th |
|
|
|
|
|
Mean 10 Min Wind >39 mph: |
0.00 Days |
|
|
N: |
0.89 Days |
|
|
NE: |
1.44 Days |
|
|
E: |
5.02 Days |
|
|
SE: |
6.81 Days |
|
|
S: |
4.93 Days |
|
|
SW: |
3.22 Days |
|
|
W: |
3.57 Days |
|
|
NW: |
1.14 Days |
|
|
Calm: |
3.99 Days |
|
|
Wind Chill Low: |
-4.1ºC |
1st |
|
Mean Wind: |
5.7 mph |
|
|
Max Gust: |
36 mph |
15th |
|
|
|
|
|
Mean Cloud Cover: |
73% |
|
|
Mean RH @ 9am: |
86% |
|
|
Rain Duration >0.1mm/hour: |
50.3 Hours |
|
|
Frost Duration: |
11.5 Hours |
|
|
Max Frost Duration in a Day: |
5.8 Hours |
1st |
|
|
|
|
|
Mean Sea Temperature: |
7.8ºC |
(-0.3ºC) |
|
Normal for Month: |
8.1ºC |
|
|
Max Sea Temperature: |
8.7ºC |
24th |
|
Min Sea Temperature: |
6.9ºC |
2nd |
|
|
|
|
|
Mean Pressure @ 9am: |
1013.7 hPa |
(-1.4 hPa) |
|
Mean Pressure: |
1013.7 hPa |
(-1.4 hPa) |
|
Max Pressure: |
1032.2 hPa |
28th |
|
Min Pressure: |
984.4 hPa |
15th |
|
|
|
|
|
Max Dewpoint: |
11.6ºC |
23rd |
|
Min Dewpoint: |
-2.8ºC |
1st |
|
Mean Dewpoint: |
5.4ºC |
|
|
|
|
|
|
Max Humidity: |
98% |
1st |
|
Min Humidity: |
54% |
26th |
|
Mean Humidity: |
85% |
(+1) |
|
|
Winter ends with an extremely warm February after a very
cold December, and a cool January.
Temperatures during
February remained at average or above throughout leading
to one of the warmest Februaries on record. |
|
Rainfall was slightly
below average. |
|
Only 2
air frosts and both of these were slight. Several very
clear, calm nights led to 10 grass frosts. As with
January, no snow was seen falling or lying at any point
during the month. |
|
Sunshine
levels were extremely disappointing throughout the month
making this February the dullest month in the station
record with only 66% of the average. |
|
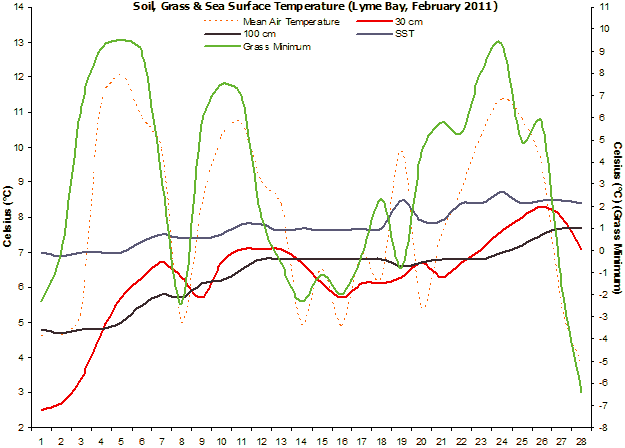
Soil temperatures were
well below normal at the beginning but ended up
slightly above normal. |
|
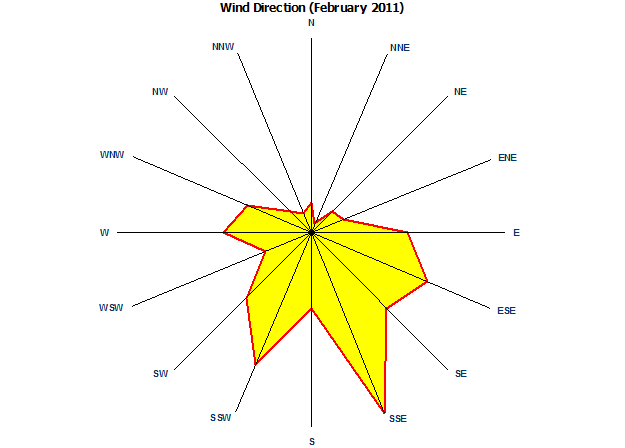
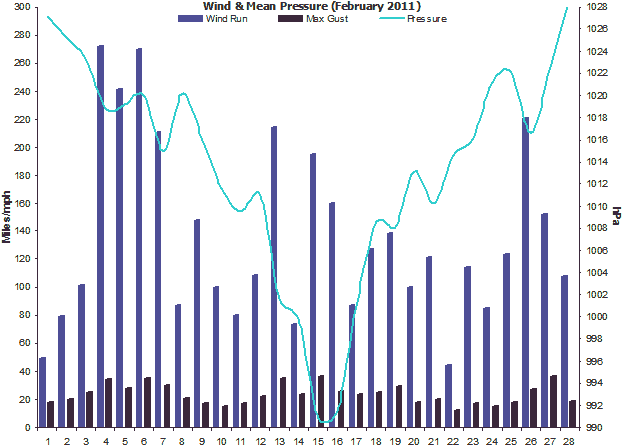
Winds were dominant from a
south-easterly direction. |
|
Rainfall duration was only
50 hours and cloud amounts were record-breakingly high. |
|
Sea temperatures gradually
recovered from low levels at the beginning of the
month. Even so, they ended up being slightly below
normal despite the warm February. |
|
Mean pressure was rather
below
average for February. |
|
Dewpoints were above
average. |
|
The RH ended up being
slightly above normal. |
|
|
|
Weather Data for Otter Valley, Devon. |
February 2011 |
|
|
|
Temp (oC) |
Hum (RH%) |
Dewpoint (oC) |
Wind (mph) |
Rain |
Pressure (hPa) |
Grass |
Sun |
|
|
|
Min |
Max |
Ave |
Min |
Max |
Ave |
Min |
Max |
Ave |
Max |
Ave |
Run |
mm |
Min |
Max |
Ave |
Min |
Hours |
Observations |
|
1 |
-1.4 |
10.6 |
4.6 |
76 |
98 |
87 |
-2.8 |
8.0 |
2.6 |
18 |
2.1 |
49 |
0.0 |
1025 |
1029 |
1027 |
-2.3 |
4.6 |
Cloudy am, sunny pm |
|
2 |
-1.3 |
10.6 |
4.7 |
88 |
91 |
90 |
3.3 |
7.4 |
5.4 |
20 |
3.3 |
79 |
1.8 |
1021 |
1030 |
1025 |
0.0 |
2.2 |
Sunny intervals all day |
|
3 |
0.5 |
9.9 |
5.2 |
75 |
76 |
76 |
5.1 |
6.0 |
5.6 |
25 |
4.2 |
101 |
0.0 |
1020 |
1027 |
1023 |
6.5 |
1.0 |
Cloudy am, sunny ints pm |
|
4 |
10.2 |
12.2 |
11.2 |
67 |
79 |
73 |
5.7 |
7.4 |
6.6 |
34 |
11.3 |
272 |
0.0 |
1018 |
1020 |
1019 |
9.1 |
0.2 |
Cloudy am, sunny ints pm |
|
5 |
11.1 |
13.0 |
12.1 |
69 |
87 |
78 |
7.1 |
8.4 |
7.8 |
28 |
10.1 |
241 |
0.0 |
1018 |
1020 |
1019 |
9.5 |
0.0 |
Cloudy all day |
|
6 |
10.3 |
11.4 |
10.9 |
73 |
75 |
74 |
5.4 |
5.9 |
5.7 |
35 |
11.2 |
270 |
0.4 |
1019 |
1021 |
1020 |
9.0 |
0.1 |
Cloudy am, bright pm |
|
7 |
9.2 |
10.7 |
10.0 |
62 |
92 |
77 |
2.0 |
9.4 |
5.7 |
30 |
8.8 |
211 |
0.7 |
1011 |
1019 |
1015 |
3.3 |
2.4 |
Sunny intervals all day |
|
8 |
0.3 |
9.7 |
5.0 |
74 |
98 |
86 |
-2.1 |
8.0 |
3.0 |
21 |
3.6 |
87 |
0.0 |
1018 |
1023 |
1020 |
-2.4 |
4.6 |
Cloudy am, sunny pm |
|
9 |
7.4 |
9.0 |
8.2 |
87 |
96 |
92 |
6.3 |
8.8 |
7.6 |
17 |
6.2 |
148 |
0.0 |
1014 |
1018 |
1016 |
5.7 |
0.0 |
Cloudy all day |
|
10 |
9.3 |
11.3 |
10.3 |
88 |
98 |
93 |
6.9 |
11.1 |
9.0 |
15 |
4.2 |
101 |
5.7 |
1008 |
1015 |
1012 |
7.5 |
0.0 |
Cloudy all day |
|
11 |
8.1 |
13.3 |
10.7 |
78 |
98 |
88 |
6.5 |
11.3 |
8.9 |
17 |
3.3 |
80 |
1.3 |
1008 |
1011 |
1010 |
7.0 |
2.1 |
Cloudy am, sunny ints pm |
|
12 |
6.6 |
11.4 |
9.0 |
83 |
86 |
85 |
4.1 |
5.9 |
5.0 |
22 |
4.5 |
109 |
0.0 |
1009 |
1013 |
1011 |
1.5 |
3.8 |
Sunny intervals all day |
|
13 |
7.9 |
8.8 |
8.4 |
86 |
96 |
91 |
1.4 |
8.2 |
4.8 |
35 |
8.9 |
214 |
17.8 |
995 |
1008 |
1002 |
-0.6 |
0.2 |
Rain int all day, fine evening |
|
14 |
0.6 |
9.3 |
5.0 |
65 |
98 |
82 |
-0.9 |
6.0 |
2.6 |
23 |
3.1 |
74 |
0.4 |
998 |
1002 |
1000 |
-2.3 |
5.4 |
Sunny am, light showers pm |
|
15 |
4.1 |
8.9 |
6.5 |
83 |
96 |
90 |
1.2 |
8.0 |
4.6 |
36 |
8.1 |
195 |
11.7 |
984 |
997 |
991 |
-1.1 |
0.4 |
Showers, brief sunny ints |
|
16 |
1.2 |
8.6 |
4.9 |
83 |
98 |
91 |
-0.2 |
6.9 |
3.4 |
26 |
6.6 |
160 |
2.2 |
989 |
994 |
991 |
-2.0 |
0.1 |
Brief sunny intervals |
|
17 |
4.1 |
9.8 |
7.0 |
81 |
96 |
89 |
1.0 |
7.1 |
4.1 |
24 |
3.6 |
87 |
1.1 |
994 |
1008 |
1001 |
-0.2 |
2.2 |
Cloudy am, sunny ints pm |
|
18 |
3.7 |
8.7 |
6.2 |
87 |
97 |
92 |
2.4 |
7.4 |
4.9 |
25 |
5.3 |
127 |
1.1 |
1007 |
1011 |
1009 |
2.3 |
0.0 |
Cloudy all day |
|
19 |
7.7 |
12.1 |
9.9 |
68 |
98 |
83 |
0.3 |
8.5 |
4.4 |
29 |
5.8 |
139 |
9.0 |
1004 |
1012 |
1008 |
-0.8 |
5.8 |
Bright am, sunny pm |
|
20 |
2.1 |
8.8 |
5.5 |
77 |
97 |
87 |
-1.9 |
6.6 |
2.4 |
18 |
3.9 |
101 |
0.0 |
1012 |
1014 |
1013 |
4.4 |
0.7 |
Brief sunny ints midday |
|
21 |
6.2 |
8.7 |
7.5 |
91 |
98 |
95 |
4.7 |
8.5 |
6.6 |
20 |
5.1 |
121 |
4.0 |
1007 |
1013 |
1010 |
5.8 |
0.0 |
Rain intermittent all day |
|
22 |
6.4 |
11.1 |
8.8 |
64 |
98 |
81 |
5.0 |
8.9 |
7.0 |
12 |
1.8 |
44 |
0.0 |
1012 |
1017 |
1015 |
5.3 |
0.4 |
Brief sunny intervals all day |
|
23 |
8.3 |
12.3 |
10.3 |
82 |
98 |
90 |
7.5 |
11.6 |
9.6 |
17 |
4.8 |
115 |
3.5 |
1015 |
1017 |
1016 |
8.1 |
1.5 |
Brief sunny intervals all day |
|
24 |
8.4 |
14.3 |
11.4 |
93 |
93 |
93 |
8.8 |
8.8 |
8.8 |
15 |
3.8 |
85 |
0.0 |
1017 |
1025 |
1021 |
9.3 |
5.7 |
Sunny intervals all day |
|
25 |
9.5 |
12.1 |
10.8 |
84 |
96 |
90 |
8.0 |
10.1 |
9.1 |
18 |
5.2 |
124 |
0.0 |
1019 |
1026 |
1022 |
4.9 |
0.0 |
Cloudy all day |
|
26 |
7.6 |
11.3 |
9.5 |
54 |
97 |
76 |
1.1 |
9.9 |
5.5 |
27 |
9.2 |
220 |
6.2 |
1012 |
1021 |
1017 |
5.8 |
4.6 |
Showers am, sunny pm |
|
27 |
1.3 |
9.6 |
5.5 |
69 |
91 |
80 |
-2.3 |
5.9 |
1.8 |
36 |
6.3 |
152 |
1.8 |
1020 |
1025 |
1023 |
-1.6 |
4.5 |
Sunny am, showers pm |
|
28 |
0.2 |
7.3 |
3.8 |
65 |
89 |
77 |
-2.6 |
3.0 |
0.2 |
19 |
4.9 |
108 |
0.0 |
1025 |
1032 |
1029 |
-6.4 |
1.1 |
Sunny ints am, cloudy pm |
|
|
5.3 |
10.5 |
7.9 |
77 |
93 |
85 |
2.9 |
8.0 |
5.4 |
24 |
5.7 |
3811 |
68.6 |
1011 |
1017 |
1014 |
3.2 |
53.4 |
|
Graphs for
February 2011 |
 |
|
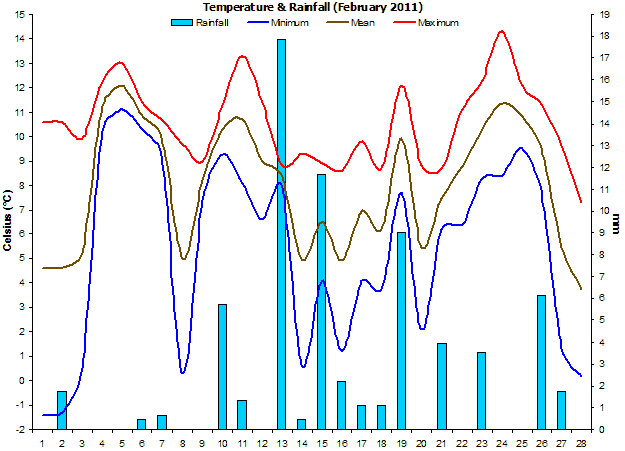
Figure 1. Temperature and
Rainfall for February 2011. |
 |
|
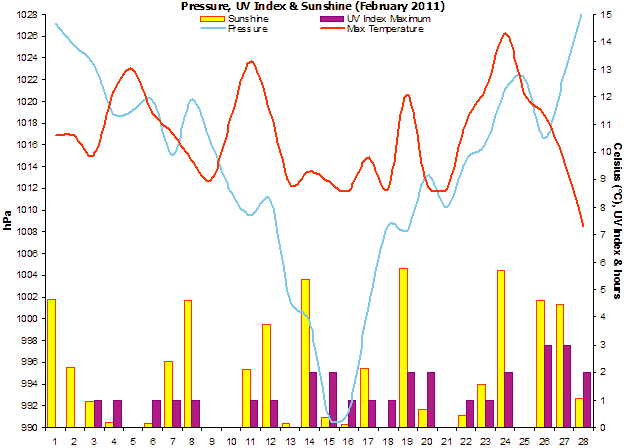
Figure 2. Sunshine, air
pressure and mean wind speed for February 2011. |
 |
|
Figure 3.
Wind direction for February 2011. |
 |
|
Figure 4. Soil & sea
surface temperature (SST) for Lyme Bay for February 2011. |
 |
|
Figure 5.
Wind run,
maximum gusts and mean pressure for February 2011. |
|