October 2011

Autumnal sycamore leaves here in the Otter Valley.

Summary for  October 2011
Mean Max: 16.9ºC (+2.1ºC)
Mean Min: 10.2ºC (+2.5ºC)
Mean: 13.6ºC (+2.3ºC)
     
High Max: 27.0ºC 1st
Low Max: 12.1ºC 20th
High Min: 15.3ºC 5th
Low Min: 2.4ºC 29th
Mean Grass Min: 8.1ºC  
Grass Min: 1.3ºC 20th
     
Rain Total (gauge): 71.0 mm (89%)
Rain Total (tipping bucket): 63.8 mm (80%)
Rain Days >0.2 mm: 13 Days  
Rain Days >1.0 mm: 7 Days  
Max 24 hrs: 24.8 mm 24th
Days without any rain: 18  
     
Air Frost: 0 Days  
Ground Frost: 0 Days  
Snow Falling: 0 Days  
Snow (50%) @ 9am: 0 Days  
Thunder Heard: 1 Day  
Hail <5 mm: 0 Days  
Hail >5 mm: 0 Days  
Fog @ 9am: 0 Days  
     
Total Monthly Sunshine: 120h:20m  
Total Monthly Sunshine: 120.3 Hours (95%)
Most Sunshine in a Day: 11.0 2nd 
Average Daily Sunshine: 03h:52m  
Sunless Days: 3 Days  
Cloudless Days: 4 Days  
Total Possible Sunshine: 332h:16m  
Percentage of Total Sun: 36%  
Maximum UV Index: 3 8th
Average UV Index: 1.1  
     
Mean Soil Temp @ 30 cm: 15.2ºC  
Min Soil Temp @ 30 cm: 12.4ºC 29th
Max Soil Temp @ 30 cm: 17.7ºC 4th
Mean Soil Temp @ 100 cm: 16.8ºC  
Min Soil Temp @ 100 cm: 15.1ºC 31st
Max Soil Temp @ 100 cm: 18.0ºC 5th
     
Mean 10 Min Wind >39 mph: 0.00 Days  
N: 0.43 Days  
NE: 0.82 Days  
E: 3.10 Days  
SE: 6.71 Days  
S: 4.41 Days  
SW: 3.22 Days  
W: 7.32 Days  
NW: 2.84 Days  
Calm: 2.15 Days  
Wind Chill Low: 1.8ºC 29th
Mean Wind: 5.0 mph  
Max Gust: 44 mph 24th
     
Mean Cloud Cover: 63%  
Mean RH @ 9am: 87%  
Rain Duration >0.1mm/hour: 35.3 Hours  
Frost Duration: 0.0 Hours  
Max Frost Duration in a Day: 0.0 Hours  
     
Mean Sea Temperature: 15.8ºC (+0.4ºC)
Normal for Month: 17.5ºC  
Max Sea Temperature: 17.6ºC 1st
Min Sea Temperature: 14.4ºC 29th
     
Mean Pressure @ 9am: 1017.2 hPa (+2.8 hPa)
Mean Pressure: 1016.4 hPa (+2.0 hPa)
Max Pressure: 1029.2 hPa 20th
Min Pressure: 984.7 hPa 24th
     
Max Dewpoint: 17.3ºC 2nd 
Min Dewpoint: -0.5ºC 29th
Mean Dewpoint: 9.4ºC  
     
Max Humidity: 93% 2nd 
Min Humidity: 51% 1st
Mean Humidity: 80% (-5)


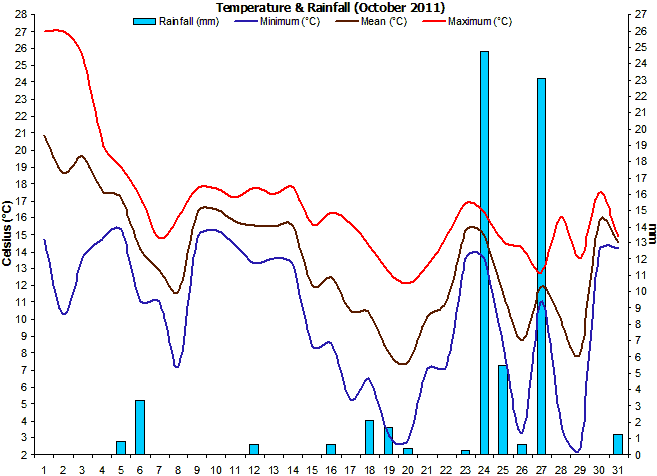
A warm and relatively settled month.

October started as September left-off with record-breaking warm temperatures. The 'heatwave' last until the 4th but overall the day temperatures remained above normal with plenty of warm nights as well. This has led to the warmest October since before 2005.

This month was fairly dry until the 24th, then it turned very wet, but overall rainfall was a little below the eLTA.
Air frosts are quite rare in October for this part of Devon, but unusually there were no grass frosts when 1 or 2 would normally be expected towards the end of the month.
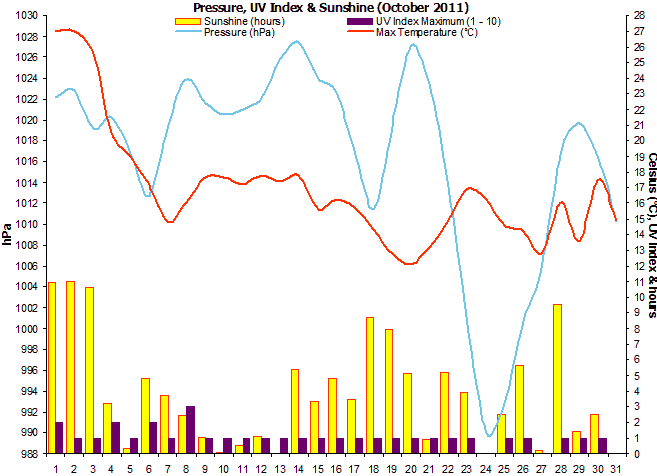
Sunshine levels were slightly below the long term average despite the very sunny start to the month. This continues a run of months with below average sunshine that started in May this year.
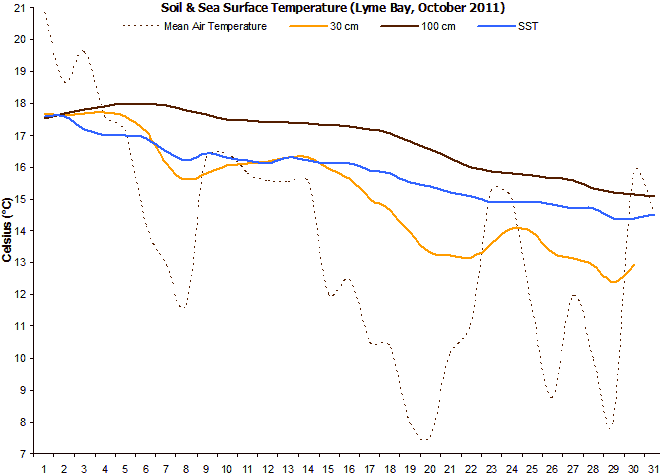
Soil temperatures were above normal at the beginning of the month and continued that way through to the end.
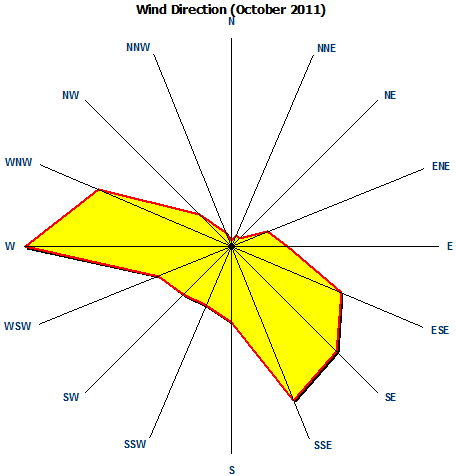
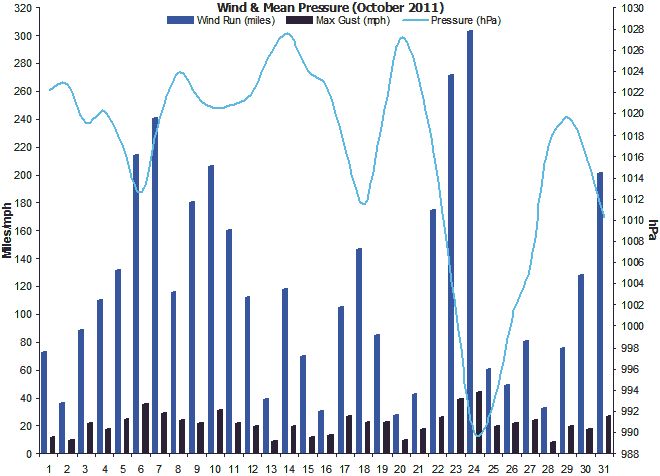
Wind was dominant from the W, S & SE directions. It was not a particularly windy month except for the 24th, which ended up having the most wind miles this year so far.
Rainfall duration was 35.3 hours even though over 70 mm fell. This was due to it being short-lived but very heavy.
Sea surface temperatures were above normal at the beginning of the month and generally stayed that way.
Mean pressure was above the average for October and indicative of the generally settled nature of this month.
Dewpoints were above average, mainly because of predominately damp and warm westerly airstreams.
Despite the higher than average dewpoints, the relative humidity was below normal, probably due to the warmth that dominated through the month.
Weather Data for Otter Valley, Devon.  October 2011  
  Temp (oC) Hum (RH%) Dewpoint (oC) Wind (mph) Rain Pressure (hPa) Grass Sun  
  Min Max Ave Min Max Ave Min Max Ave Max Ave Run mm Min Max Ave Min Hours Observations
1 14.7 27.0 20.9 51 88 70 11.4 15.9 13.7 12 3.0 72 0.0 1021 1024 1022 10.3 10.9 Sunny all day
2 10.3 27.0 18.7 52 93 73 7.1 17.3 12.2 10 1.5 36 0.0 1021 1024 1023 8.7 11.0 Sunny all day
3 13.6 25.6 19.6 55 91 73 10.2 17.2 13.7 22 3.7 88 0.0 1016 1022 1019 11.8 10.6 Sunny all day
4 14.7 20.5 17.6 66 87 77 11.1 13.7 12.4 17 4.6 111 0.0 1019 1022 1020 13.0 3.2 Sunny intervals all day
5 15.3 19.0 17.2 74 90 82 11.9 14.3 13.1 25 5.5 132 0.8 1013 1021 1017 13.8 0.3 Brief sunny intervals all day
6 11.1 17.2 14.2 62 90 76 5.4 14.7 10.1 35 8.9 214 3.4 1010 1015 1013 7.5 4.8 Sunny intervals all day
7 11.0 14.8 12.9 67 81 74 5.5 8.4 7.0 29 10.0 241 0.0 1015 1025 1020 5.5 3.7 Sunny intervals all day
8 7.2 16.1 11.7 75 90 83 3.7 12.2 8.0 24 4.8 116 0.0 1022 1026 1024 5.1 2.4 Sunny intervals all day
9 14.8 17.7 16.3 82 91 87 12.0 14.0 13.0 22 7.5 180 0.0 1020 1023 1022 13.6 1.1 Brief sunny intervals all day
10 15.2 17.7 16.5 79 88 84 11.8 13.4 12.6 31 8.6 206 0.0 1020 1022 1021 14.1 0.1 Brief sunny intervals all day
11 14.4 17.2 15.8 77 90 84 11.5 12.7 12.1 22 6.7 160 0.0 1020 1022 1021 13.6 0.5 Brief sunny intervals all day
12 13.3 17.8 15.6 79 92 86 10.3 14.2 12.3 19 4.7 112 0.6 1021 1024 1022 13.0 1.1 Sunny intervals all day
13 13.6 17.4 15.5 87 92 90 11.1 14.8 13.0 9 1.6 39 0.0 1024 1028 1026 13.2 0.0 Cloudy all day
14 13.2 17.8 15.5 64 91 78 7.5 12.7 10.1 19 4.9 118 0.0 1026 1029 1027 11.8 5.4 Sunny intervals all day
15 8.4 15.6 12.0 69 89 79 5.4 10.6 8.0 12 2.9 70 0.0 1022 1026 1024 6.7 3.3 Sunny intervals all day
16 8.6 16.3 12.5 67 92 80 5.0 12.8 8.9 13 1.3 30 0.6 1022 1024 1023 4.9 4.8 Cloudy am, sunny pm
17 5.3 15.7 10.5 63 92 78 1.2 11.3 6.3 27 4.4 105 0.0 1011 1023 1017 3.4 3.5 Sunny intervals all day
18 6.4 14.3 10.4 54 88 71 2.8 10.7 6.8 23 6.1 147 2.1 1009 1014 1011 3.4 8.7 Sunny intervals all day
19 3.1 12.8 8.0 58 90 74 0.1 6.0 3.1 23 3.5 85 1.7 1014 1025 1019 1.5 7.9 Sunny intervals all day
20 2.9 12.1 7.5 64 91 78 -0.2 6.8 3.3 10 1.0 27 0.4 1025 1029 1027 1.3 5.1 Sunny intervals all day
21 7.1 13.2 10.2 70 87 79 3.9 7.7 5.8 17 1.8 43 0.0 1020 1027 1024 4.5 0.9 Sunny ints am, cloudy pm
22 7.2 14.9 11.1 63 88 76 3.3 10.4 6.9 26 7.3 175 0.0 1007 1020 1014 6.8 5.2 Sunny intervals all day
23 13.6 16.9 15.3 72 89 81 10.4 12.7 11.6 39 11.0 272 0.2 995 1007 1001 11.0 3.9 Sunny ints, windy pm
24 13.6 16.3 15.0 75 91 83 9.0 12.0 10.5 44 13.8 304 24.8 985 995 990 9.2 0.0 Rain intermittent all day
25 8.4 14.6 11.5 68 92 80 2.7 9.5 6.1 19 2.6 61 5.5 988 998 993 3.3 2.5 Sunny ints am, showers pm
26 3.3 14.2 8.8 66 93 80 0.6 9.2 4.9 22 2.0 49 0.6 998 1004 1001 2.7 5.7 Sunny intervals all day
27 11.1 12.8 12.0 85 92 89 7.9 11.0 9.5 24 3.4 81 23.1 1001 1010 1006 6.4 0.2 Rain all day, fine evening
28 3.8 16.1 10.0 71 93 82 1.8 12.0 6.9 8 1.4 33 0.0 1011 1023 1017 2.4 9.5 Sunny all day
29 2.4 13.6 8.0 83 92 88 -0.5 11.3 5.4 19 3.2 76 0.0 1017 1023 1020 1.6 1.4 Sunny ints am, cloudy pm
30 14.1 17.5 15.8 77 91 84 11.5 13.7 12.6 17 5.4 129 0.0 1015 1017 1016 12.2 2.5 Sunny ints am, cloudy pm
31 14.2 14.9 14.6 87 93 90 11.8 13.1 12.5 27 8.3 202 1.3 1005 1015 1010 13.3 0.0 Cloudy all day
10.2 16.9 13.6 70 90 80 6.7 12.1 9.4 21 5.0 3709 63.8 1013 1020 1016 8.1 120.3  

Graphs for October 2011

Figure 1. Temperature and Rainfall for October 2011.
Figure 2. Sunshine, air pressure and mean wind speed for October 2011.
Figure 3. Wind direction for October 2011.
Figure 4. Soil & sea surface temperature (SST) for Lyme Bay for October 2011.
Figure 5. Wind run, maximum gusts and mean pressure for October 2011.