|
February 2012 |
|
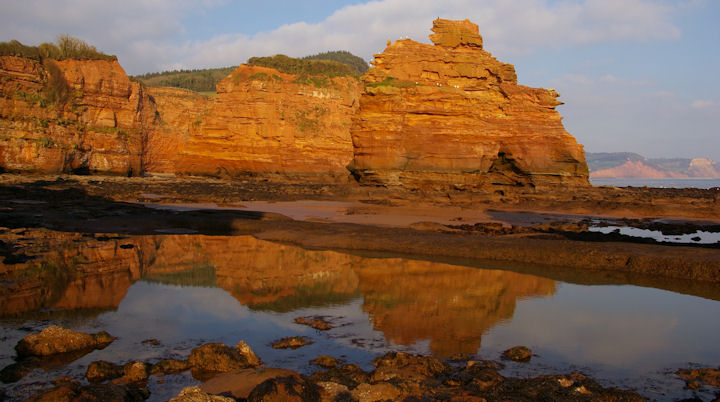
Spectacular Triassic sandstone sea
stacks at the western end of Jacob's Ladder Beach, Sidmouth
photographed on a warm and sunny February day at a low spring tide. |
|
Summary for |
February
2012 |
|
Mean Max: |
9.0ºC |
(+0.4ºC) |
|
Mean Min: |
2.9ºC |
(+0.1ºC) |
|
Mean: |
6.0ºC |
(+0.3ºC) |
|
|
|
|
|
High Max: |
13.4ºC |
23rd |
|
Low Max: |
1.9ºC |
8th |
|
High Min: |
11.3ºC |
23rd |
|
Low Min: |
-5.8ºC |
4th |
|
Mean Grass Min: |
N/A |
|
|
Grass Min: |
N/A |
|
|
|
|
|
|
Rain Total (gauge): |
23.2 mm |
(30%) |
|
Rain Total (tipping bucket): |
23.0 mm |
(29%) |
|
Rain Days >0.2 mm: |
6 Days |
|
|
Rain Days >1.0 mm: |
4 Days |
|
|
Max 24 hrs: |
9.4 mm |
10th |
|
Days without any rain: |
23 |
|
|
|
|
|
|
Air Frost: |
9 Days |
|
|
Ground Frost: |
N/A |
|
|
Snow Falling: |
0 Days |
|
|
Snow (50%) @ 9am: |
0 Days |
|
|
Thunder Heard: |
0 Days |
|
|
Hail <5 mm: |
0 Days |
|
|
Hail >5 mm: |
0 Days |
|
|
Fog @ 9am: |
1 Days |
|
|
|
|
|
|
Total Monthly Sunshine: |
95.8 Hours |
(120%) |
|
Most Sunshine in a Day: |
9.9 Hours |
26th |
|
Average Daily Sunshine: |
3.3 Hours |
|
|
Sunless Days: |
3 Days |
|
|
Cloudless Days: |
3 Days |
|
|
Total Possible Sunshine: |
291.6 Hours |
|
|
Percentage of Total Sun: |
33% |
|
|
Maximum UV Index: |
2.3 |
16th |
|
Time of Max UV |
|
12:30 |
|
|
|
|
|
Mean Soil Temp @ 30 cm: |
N/A |
|
|
Min Soil Temp @ 30 cm: |
N/A |
|
|
Max Soil Temp @ 30 cm: |
N/A |
|
|
Mean Soil Temp @ 100 cm: |
N/A |
|
|
Min Soil Temp @ 100 cm: |
N/A |
|
|
Max Soil Temp @ 100 cm: |
N/A |
|
|
|
|
|
|
Mean 10 Min Wind >39 mph: |
0.00 Days |
|
|
N: |
10.53 Days |
|
|
NE: |
2.22 Days |
|
|
E: |
1.71 Days |
|
|
SE: |
1.15 Days |
|
|
S: |
4.05 Days |
|
|
SW: |
1.71 Days |
|
|
W: |
0.53 Days |
|
|
NW: |
6.40 Days |
|
|
Calm: |
0.71 Days |
|
|
Wind Chill Low: |
-7.9ºC |
4th |
|
Mean Wind: |
2.6 mph |
|
|
Max Gust: |
25 mph |
18th |
|
|
29.00 Days |
|
|
Mean Cloud Cover: |
67% |
|
|
Mean RH @ 9am: |
91% |
|
|
Rain Duration >0.1mm/hour: |
21.3 Hours |
|
|
Frost Duration: |
107.8 Hours |
|
|
Max Frost Duration in a Day: |
17.5 Hours |
3rd |
|
|
|
|
|
Mean Sea Temperature: |
7.8ºC |
(-0.3ºC) |
|
Normal for Month: |
8.1ºC |
|
|
Max Sea Temperature: |
8.7ºC |
26th |
|
Min Sea Temperature: |
6.9ºC |
11th |
|
|
|
|
|
Mean Pressure @ 9am: |
1030.9 hPa |
(+15.8 hPa) |
|
Mean Pressure: |
1030.1 hPa |
(+15.0 hPa) |
|
Max Pressure: |
1042.0 hPa |
8th |
|
Min Pressure: |
1009.5 hPa |
18th |
|
|
|
|
|
Radiation Daily Mean |
5.8 MJ/m² |
|
|
Max Daily Value |
13.5 MJ/m² |
26th |
|
Min Daily Value |
1.2 MJ/m² |
10th |
|
Number of Days with Data |
29 Days |
|
|
1-Hour Maximum |
619 W/m² |
19th |
|
Starting Time of the Hour |
|
12:45 |
|
|
|
|
|
Max Dewpoint: |
11.6ºC |
23rd |
|
Min Dewpoint: |
-7.9ºC |
4th |
|
Mean Dewpoint: |
3.0ºC |
|
|
|
|
|
|
Max Humidity: |
98% |
13th |
|
Min Humidity: |
52% |
2nd |
|
Mean Humidity: |
84% |
(-0) |
|
|
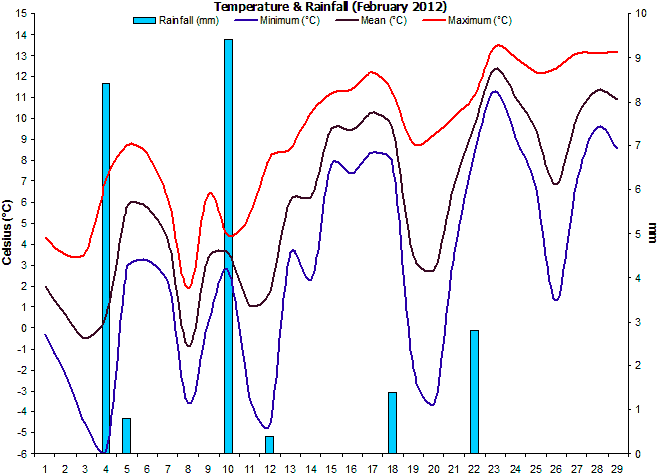
A generally dry, settled month with just a few brief
rainy spells. Overall slightly warmer than average.
This
month started cold, especially at night, until the 12th
then it warmed considerably and remained that way until
the end of the month. From the 23rd onwards it was very
mild by day. |
|
Rainfall was well below
the average and occurred on just a few days. 18.4 mm of
the total fell on just two days. This was the driest
February since before 2005 and continues a run of months
with lower than average rainfall. |
|
There
were 9 air frosts, most of which happened during the
first half of the month. Three of the frosts could be
considered as quite harsh (for here), that is they were
below -4°C. |
|
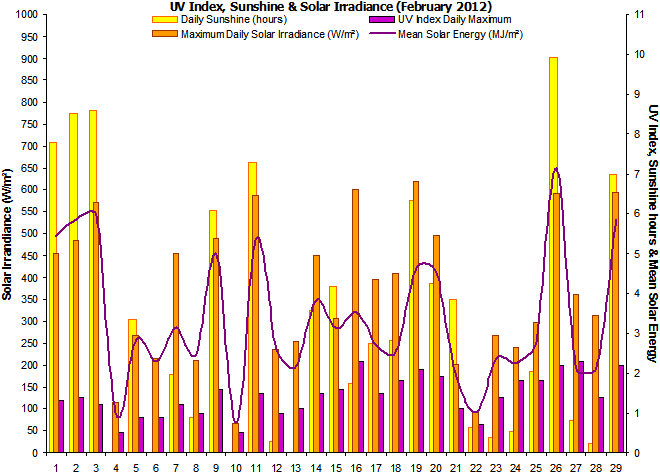
Sunshine
levels were a little above the long term average for
February. A particularly sunny, clear day on the 26th
with 9.9 hours, this was 93% of the total possible. As
expected for February, UV levels remained low but did
increase steadily, especially during the last week of
the month signifying the extra strength of the sun and
heralding the arrival of spring. |
|
No soil temperature
readings were taken due to relocation of sensors. |
|
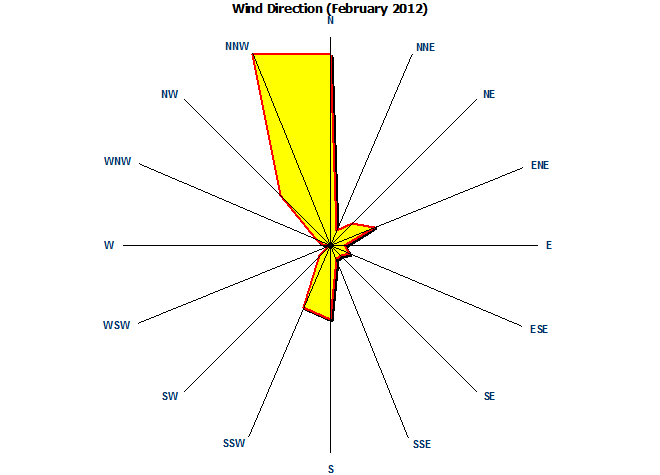
Interestingly, for a month
that was so warm the dominant wind direction was
north. On the whole winds were generally
light with the monthly maximum gust of only 25 mph. |
|
Rainfall of any
significance only fell of 4 out of the 29 days. |
|
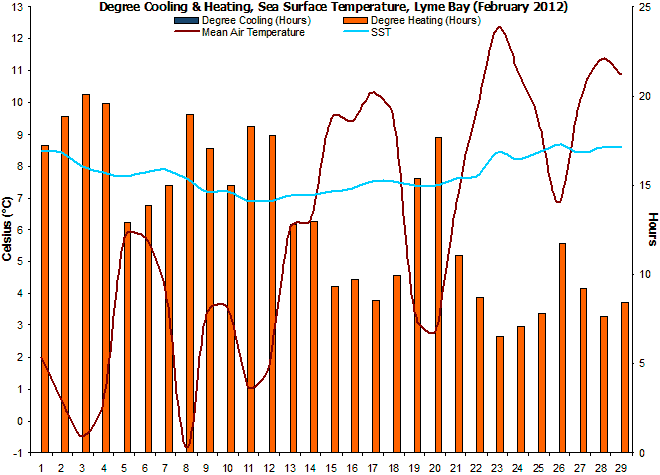
Sea surface temperatures
fell slowly during the cold weather that dominated the
first 12 days of the month, then they rose gradually
reaching a peak on the 26th. |
|
Mean pressure was well
above the average for February and indicative of the settled nature
of this month. This was the highest pressure anomaly of
any month recorded since before 2005. |
|
A new sensor has been
added that measures solar irradiance in watts per square
metre falling on a horizontal surface. |
|
Dewpoints were often below
the average due to a cold, easterly airstream during the
1st week. |
|
Despite the lower than
average dewpoint, the relative humidity was
normal. |
|
|
|
Weather Data for Otter Valley, Devon. |
February 2012 |
|
|
|
Temp (oC) |
Hum (RH%) |
Dewpoint (oC) |
Wind (mph) |
Rain |
Pressure (hPa) |
Sun |
Sun |
|
|
|
Min |
Max |
Ave |
Min |
Max |
Ave |
Min |
Max |
Ave |
Max |
Ave |
Run |
mm |
Min |
Max |
Ave |
W/m² |
Hours |
Observations |
|
1 |
-0.3 |
4.3 |
2.0 |
64 |
85 |
75 |
-4.9 |
-1.0 |
-3.0 |
16 |
2.8 |
66 |
0.0 |
1028 |
1034 |
1031 |
453 |
7.8 |
Mist am, then sunny |
|
2 |
-2.2 |
3.5 |
0.7 |
52 |
77 |
65 |
-6.3 |
-4.6 |
-5.5 |
17 |
3.1 |
75 |
0.0 |
1034 |
1037 |
1035 |
485 |
8.5 |
Sunny all day |
|
3 |
-4.6 |
3.6 |
-0.5 |
56 |
87 |
72 |
-7.4 |
-4.1 |
-5.8 |
13 |
1.7 |
40 |
0.0 |
1037 |
1041 |
1039 |
570 |
8.6 |
Sunny all day |
|
4 |
-5.8 |
7.1 |
0.7 |
86 |
97 |
92 |
-7.9 |
6.6 |
-0.7 |
21 |
3.4 |
83 |
8.4 |
1025 |
1040 |
1033 |
114 |
0.0 |
Cloudy am, rain pm |
|
5 |
2.8 |
8.7 |
5.8 |
77 |
97 |
87 |
1.1 |
6.7 |
3.9 |
18 |
2.9 |
70 |
0.8 |
1021 |
1032 |
1026 |
267 |
3.4 |
Sunny intervals all day |
|
6 |
3.2 |
8.3 |
5.8 |
83 |
97 |
90 |
0.9 |
6.2 |
3.6 |
5 |
0.9 |
22 |
0.0 |
1031 |
1034 |
1032 |
215 |
0.0 |
Cloudy all day |
|
7 |
2.1 |
6.1 |
4.1 |
76 |
97 |
87 |
-0.8 |
2.6 |
0.9 |
10 |
1.1 |
27 |
0.0 |
1034 |
1041 |
1037 |
454 |
1.9 |
Sunny intervals all day |
|
8 |
-3.6 |
1.9 |
-0.9 |
72 |
90 |
81 |
-6.5 |
-0.5 |
-3.5 |
13 |
1.9 |
46 |
0.0 |
1040 |
1042 |
1041 |
211 |
0.9 |
Brief sunny intervals all day |
|
9 |
0.3 |
6.4 |
3.4 |
73 |
91 |
82 |
-3.0 |
2.1 |
-0.5 |
9 |
1.9 |
45 |
0.0 |
1037 |
1041 |
1039 |
489 |
6.1 |
Sunny all day |
|
10 |
2.7 |
4.4 |
3.6 |
78 |
96 |
87 |
-0.7 |
3.8 |
1.6 |
16 |
3.3 |
79 |
9.4 |
1034 |
1037 |
1035 |
65 |
0.0 |
Rain all day |
|
11 |
-3.3 |
5.4 |
1.1 |
68 |
93 |
81 |
-5.1 |
0.3 |
-2.4 |
11 |
1.7 |
42 |
0.0 |
1034 |
1037 |
1036 |
587 |
7.3 |
Sunny intervals all day |
|
12 |
-4.6 |
8.1 |
1.8 |
85 |
97 |
91 |
-6.3 |
5.6 |
-0.4 |
11 |
1.4 |
34 |
0.4 |
1034 |
1037 |
1035 |
234 |
0.3 |
Cloudy am, sunny ints pm |
|
13 |
3.6 |
8.6 |
6.1 |
79 |
98 |
89 |
2.7 |
5.9 |
4.3 |
17 |
2.5 |
61 |
0.0 |
1026 |
1034 |
1030 |
255 |
0.0 |
Cloudy all day |
|
14 |
2.3 |
10.3 |
6.3 |
70 |
98 |
84 |
1.1 |
5.6 |
3.4 |
18 |
2.6 |
63 |
0.0 |
1026 |
1030 |
1028 |
450 |
3.6 |
Sunny intervals all day |
|
15 |
7.8 |
11.2 |
9.5 |
70 |
83 |
77 |
3.4 |
6.3 |
4.9 |
21 |
6.3 |
152 |
0.0 |
1026 |
1031 |
1028 |
307 |
4.2 |
Sunny intervals all day |
|
16 |
7.4 |
11.4 |
9.4 |
64 |
88 |
76 |
3.8 |
6.5 |
5.2 |
13 |
3.1 |
74 |
0.0 |
1028 |
1031 |
1030 |
600 |
1.7 |
Sunny ints am, cloudy pm |
|
17 |
8.4 |
12.2 |
10.3 |
78 |
93 |
86 |
5.8 |
9.7 |
7.8 |
19 |
3.0 |
72 |
0.0 |
1023 |
1029 |
1026 |
395 |
2.7 |
Cloudy am, sunny ints pm |
|
18 |
7.8 |
11.2 |
9.5 |
74 |
90 |
82 |
1.3 |
8.2 |
4.8 |
25 |
5.2 |
125 |
1.4 |
1010 |
1023 |
1016 |
411 |
2.8 |
Sunny intervals am, rain pm |
|
19 |
-1.9 |
8.8 |
3.5 |
58 |
97 |
78 |
-3.1 |
3.0 |
-0.1 |
18 |
1.7 |
41 |
0.0 |
1016 |
1032 |
1024 |
619 |
6.3 |
Sunny intervals all day |
|
20 |
-3.6 |
9.2 |
2.8 |
68 |
97 |
83 |
-5.1 |
4.8 |
-0.2 |
17 |
2.5 |
65 |
0.0 |
1030 |
1034 |
1032 |
495 |
4.2 |
Sunny intervals all day |
|
21 |
3.6 |
10.1 |
6.9 |
82 |
96 |
89 |
1.8 |
7.4 |
4.6 |
19 |
3.2 |
78 |
0.0 |
1029 |
1030 |
1029 |
202 |
3.9 |
Sunny ints am, cloudy pm |
|
22 |
8.3 |
11.1 |
9.7 |
81 |
96 |
89 |
6.7 |
11.2 |
9.0 |
25 |
7.2 |
173 |
2.8 |
1021 |
1029 |
1025 |
93 |
0.6 |
Brief sunny intervals all day |
|
23 |
11.3 |
13.4 |
12.4 |
88 |
95 |
92 |
8.6 |
11.6 |
10.1 |
13 |
2.4 |
59 |
0.0 |
1022 |
1028 |
1025 |
268 |
0.4 |
Brief sunny intervals all day |
|
24 |
9.1 |
12.9 |
11.0 |
85 |
94 |
90 |
7.9 |
10.5 |
9.2 |
12 |
1.6 |
36 |
0.0 |
1028 |
1030 |
1029 |
241 |
0.5 |
Brief sunny intervals all day |
|
25 |
6.6 |
12.2 |
9.4 |
74 |
95 |
85 |
5.0 |
9.7 |
7.4 |
11 |
1.5 |
35 |
0.0 |
1027 |
1030 |
1028 |
299 |
2.1 |
Sunny intervals all day |
|
26 |
1.3 |
12.4 |
6.9 |
67 |
98 |
83 |
0.3 |
7.3 |
3.8 |
10 |
2.0 |
49 |
0.0 |
1028 |
1030 |
1029 |
593 |
9.9 |
Sunny all day |
|
27 |
7.1 |
13.1 |
10.1 |
77 |
97 |
87 |
5.6 |
9.6 |
7.6 |
11 |
1.1 |
27 |
0.0 |
1025 |
1028 |
1026 |
361 |
0.8 |
Brief sunny intervals all day |
|
28 |
9.6 |
13.1 |
11.4 |
79 |
94 |
87 |
8.1 |
9.7 |
8.9 |
11 |
1.8 |
44 |
0.0 |
1024 |
1026 |
1025 |
313 |
0.2 |
Cloudy am, sunny ints pm |
|
29 |
8.6 |
13.2 |
10.9 |
80 |
96 |
88 |
6.7 |
10.3 |
8.5 |
13 |
1.9 |
46 |
0.0 |
1023 |
1025 |
1024 |
594 |
7.0 |
Sunny intervals all day |
|
|
2.9 |
9.0 |
6.0 |
74 |
93 |
84 |
0.5 |
5.6 |
3.0 |
15 |
2.6 |
1826 |
23.2 |
1027 |
1033 |
1030 |
367 |
95.8 |
|
Graphs for
February 2012 |
 |
|
Figure 1. Temperature and
Rainfall for February 2012. |
 |
|
Figure 2. Sunshine, UV
Index and solar irradiance for February 2012. |
 |
|
Figure 3.
Wind direction for February 2012. |
 |
|
Figure 4. Sea
surface temperature & cooling/heating days for February 2012. |
|