|
July 2012 |
|
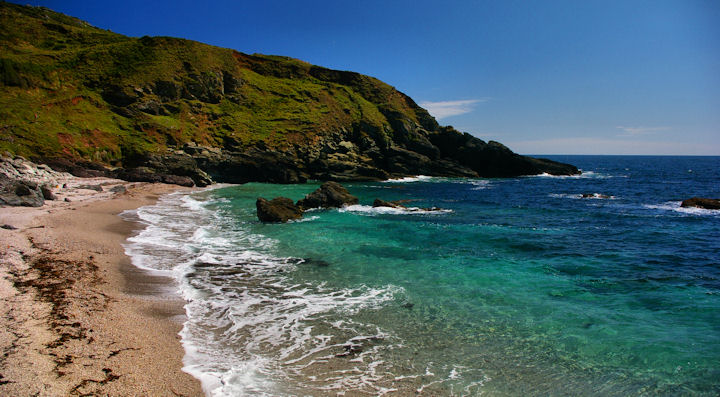
Crystal clear water at one of the many
little, quiet beaches found along the south Devon coastline.
Perfect for a cooling swim on a hot and humid July day. |
|
Summary for |
July
2012 |
|
Mean Max: |
20.3ºC |
(-1.2ºC) |
|
Mean Min: |
11.6ºC |
(-0.7ºC) |
|
Mean: |
15.9ºC |
(-1.0ºC) |
|
|
|
|
|
High Max: |
28.5ºC |
25th |
|
Low Max: |
14.6ºC |
7th |
|
High Min: |
15.1ºC |
17th |
|
Low Min: |
7.3ºC |
30th |
|
Mean Grass Min: |
10.6ºC |
|
|
Grass Min: |
5.6ºC |
30th |
|
|
|
|
|
Rain Total (gauge): |
123.6 mm |
(300%) |
|
Rain Total (tipping bucket): |
122.8 mm |
(297%) |
|
Rain Days >0.2 mm: |
15 Days |
|
|
Rain Days >1.0 mm: |
11 Days |
|
|
Max 24 hrs: |
50.8 mm |
7th |
|
Days without any rain: |
15 |
|
|
|
|
|
|
Air Frost: |
0 Days |
|
|
Grass Frost: |
0 Days |
|
|
Snow Falling: |
0 Days |
|
|
Snow (50%) @ 9am: |
0 Days |
|
|
Thunder Heard: |
3 Days |
|
|
Hail <5 mm: |
0 Days |
|
|
Hail >5 mm: |
0 Days |
|
|
Fog @ 9am: |
1 Days |
|
|
|
|
|
|
Total Monthly Sunshine: |
185.7 Hours |
(80%) |
|
Most Sunshine in a Day: |
14.9 Hours |
24th |
|
Average Daily Sunshine: |
6.0 Hours |
|
|
Sunless Days: |
3 Days |
|
|
Cloudless Days: |
5 Days |
|
|
Total Possible Sunshine: |
494.5 Hours |
|
|
Percentage of Total Sun: |
38% |
|
|
Maximum UV Index: |
8.9 |
17th |
|
Time of Max UV: |
|
13:00 |
|
|
|
|
|
Mean Soil Temp @ 30 cm: |
N/A |
|
|
Min Soil Temp @ 30 cm: |
N/A |
13th |
|
Max Soil Temp @ 30 cm: |
N/A |
26th |
|
Mean Soil Temp @ 100 cm: |
N/A |
|
|
Min Soil Temp @ 100 cm: |
N/A |
13th |
|
Max Soil Temp @ 100 cm: |
N/A |
26th |
|
|
|
|
|
Mean 10 Min Wind >39 mph: |
0.01 Days |
|
|
N: |
4.83 Days |
|
|
NE: |
0.30 Days |
|
|
E: |
0.83 Days |
|
|
SE: |
1.26 Days |
|
|
S: |
9.99 Days |
|
|
SW: |
4.68 Days |
|
|
W: |
1.32 Days |
|
|
NW: |
4.72 Days |
|
|
Calm: |
3.07 Days |
|
|
Wind Chill Low: |
6.7ºC |
21st |
|
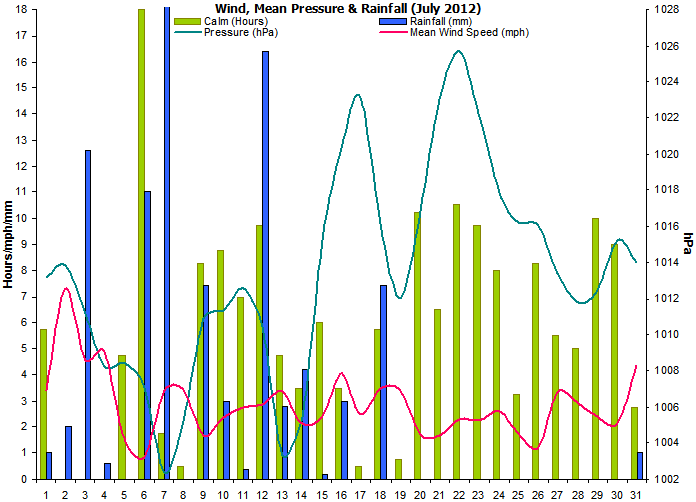
Mean Wind: |
2.9 mph |
|
|
Max Gust: |
31 mph |
7th |
|
|
31.00 Days |
|
|
Mean Cloud Cover: |
70% |
|
|
Mean RH @ 9am: |
93% |
|
|
Rain Duration >0.1mm/hour: |
58.0 Hours |
|
|
Frost Duration: |
0.0 Hours |
|
|
Max Frost Duration in a Day: |
0.0 Hours |
1st |
|
|
|
|
|
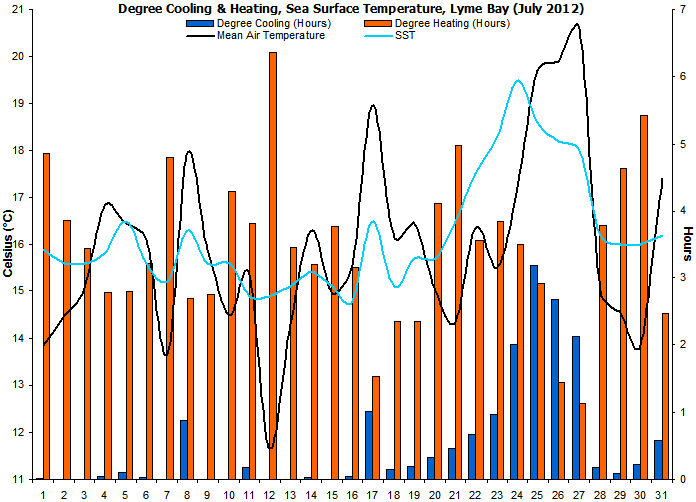
Mean Sea Temperature: |
16.2ºC |
(-1.2ºC) |
|
Normal for Month: |
17.4ºC |
|
|
Max Sea Temperature: |
19.5ºC |
24th |
|
Min Sea Temperature: |
14.8ºC |
16th |
|
|
|
|
|
Mean Pressure @ 9am: |
1013.5 hPa |
(-3.9 hPa) |
|
Mean Pressure: |
1013.4 hPa |
(-4.0 hPa) |
|
Max Pressure: |
1026.9 hPa |
22nd |
|
Min Pressure: |
999.0 hPa |
7th |
|
|
|
|
|
Radiation Daily Mean: |
16.49 MJ/m² |
|
|
Max Daily Value: |
30.18 MJ/m² |
23rd |
|
Min Daily Value: |
3.36 MJ/m² |
7th |
|
Number of Days with Data: |
31 Days |
|
|
1-Hour Maximum: |
1247 W/m² |
14th |
|
Starting Time of the Hour: |
|
13:00 |
|
|
|
|
|
Max Dewpoint: |
18.2ºC |
25th |
|
Min Dewpoint: |
6.0ºC |
30th |
|
Mean Dewpoint: |
12.7ºC |
|
|
|
|
|
|
Max Humidity: |
99% |
3rd |
|
Min Humidity: |
43% |
30th |
|
Mean Humidity: |
81% |
(+5) |
|
|
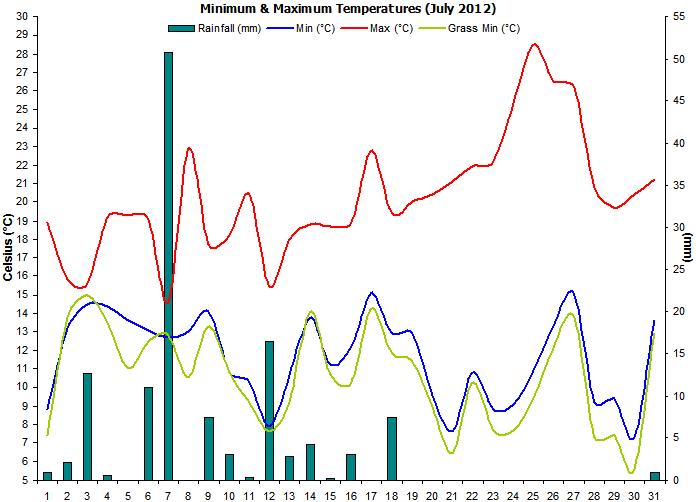
Cool,
wet and very dull for the first two weeks, then warm,
dry and sunny.
The warm
and sunny weather from the 17th onwards saved this month
from being as dreadful as June, though the month was
still below average regarding temperature. |
|
The first two weeks were
extremely wet with 115 mm falling. 51 mm of rain fell on
just 1 day (7th) leading to serious flooding problems.
The second half of the month was much drier with just
8.4 mm of rain falling. |
|
As
expected in a summer month, there
were no air frosts or grass frosts. Thunder was
heard on 3 occasions, which is rather typical for July. |
|
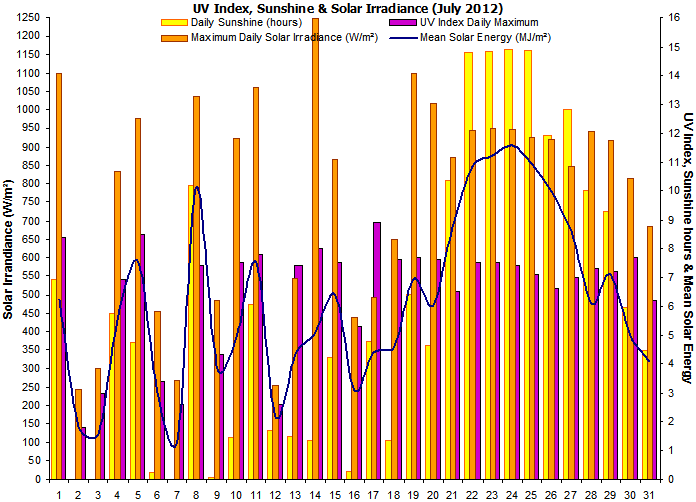
Despite a
very sunny 2nd half to the month, the extremely dull
conditions of the 1st half meant that the sunshine
levels still ended up below normal (80%). Even so, it
was a big improvement on June's sunshine. |
|
No soil temperature
readings were taken due to relocation of sensors. These
are planned to be installed in August 2012. |
|
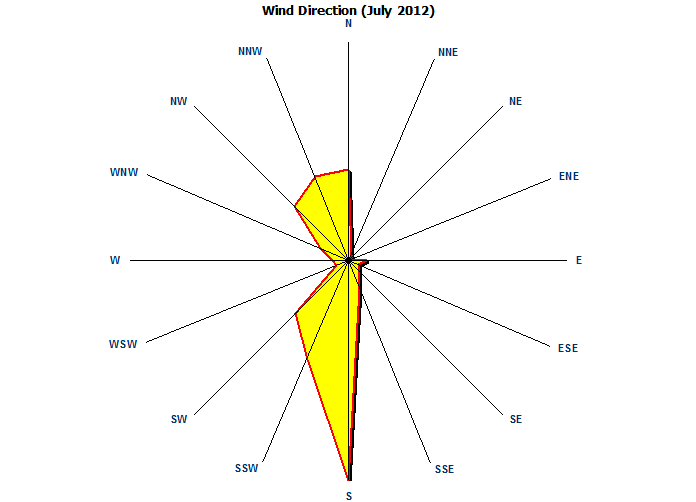
The dominant wind direction was
from a southerly direction. This was due to
frequent sea breezes and typical for a summer month at
this location near the sea. |
|
Rainfall duration was 58
hours, and representative of the wetter than normal nature of this
month. |
|
Sea surface temperatures
gradually increased up until the 7th, then fell
slightly until the 16th. The hot spell of weather during
the 3rd week soon warmed the SST and the month ended up
above normal. |
|
Mean pressure was
below the average for July and indicative of the
overall unsettled nature
of this month. |
|
A new sensor has been
added that measures solar irradiance in watts per square
metre falling on a horizontal surface. |
|
Dewpoints were often above
the average. |
|
As with the dewpoints, the relative humidity was
well-above normal. |
|
|
|
Weather Data for Otter Valley, Devon. |
July 2012 |
|
|
|
Temp (oC) |
Hum (RH%) |
Dewpoint (oC) |
Wind (mph) |
Rain |
Pressure (hPa) |
Grass |
Sun |
|
|
|
Min |
Max |
Ave |
Min |
Max |
Ave |
Min |
Max |
Ave |
Max |
Ave |
Run |
mm |
Min |
Max |
Ave |
Min |
Hours |
Observations |
|
1 |
8.8 |
18.9 |
13.9 |
60 |
97 |
79 |
7.3 |
13.2 |
10.3 |
22 |
3.4 |
81 |
1.0 |
1010 |
1016 |
1013 |
7.4 |
6.9 |
Sunny intervals all day |
|
2 |
13.2 |
15.8 |
14.5 |
81 |
98 |
90 |
11.5 |
15.4 |
13.5 |
30 |
7.3 |
175 |
2.0 |
1012 |
1016 |
1014 |
13.8 |
0.0 |
Cloudy all day |
|
3 |
14.5 |
15.6 |
15.1 |
96 |
99 |
98 |
14.0 |
15.4 |
14.7 |
19 |
4.6 |
109 |
12.6 |
1009 |
1013 |
1011 |
15.0 |
0.0 |
Rain all day |
|
4 |
14.4 |
19.2 |
16.8 |
78 |
99 |
89 |
13.8 |
17.3 |
15.6 |
18 |
4.9 |
117 |
0.6 |
1007 |
1010 |
1008 |
13.5 |
5.8 |
Drizzle am, sunny pm |
|
5 |
13.6 |
19.3 |
16.5 |
77 |
97 |
87 |
11.8 |
16.0 |
13.9 |
14 |
1.4 |
34 |
0.0 |
1008 |
1009 |
1008 |
11.0 |
4.7 |
Cloudy am, sunny ints pm |
|
6 |
13.1 |
19.1 |
16.1 |
81 |
97 |
89 |
12.3 |
16.0 |
14.2 |
14 |
0.8 |
20 |
11.0 |
1005 |
1009 |
1007 |
12.5 |
0.2 |
Cloudy am, rain pm |
|
7 |
12.7 |
14.6 |
13.7 |
95 |
98 |
97 |
11.8 |
13.9 |
12.9 |
31 |
3.4 |
82 |
50.8 |
999 |
1006 |
1002 |
12.8 |
0.0 |
Rain all day. Flooding. |
|
8 |
13.0 |
22.9 |
18.0 |
61 |
98 |
80 |
11.9 |
16.1 |
14.0 |
14 |
3.4 |
83 |
0.0 |
1001 |
1010 |
1005 |
10.5 |
10.2 |
Sunny intervals all day |
|
9 |
14.1 |
17.7 |
15.9 |
79 |
95 |
87 |
12.6 |
15.4 |
14.0 |
13 |
1.7 |
40 |
7.4 |
1010 |
1012 |
1011 |
13.3 |
0.1 |
Sunny ints am, cloudy pm |
|
10 |
10.8 |
18.2 |
14.5 |
72 |
98 |
85 |
9.5 |
14.7 |
12.1 |
15 |
2.4 |
57 |
3.0 |
1010 |
1013 |
1011 |
10.8 |
1.4 |
Sunny intervals all day |
|
11 |
10.3 |
20.4 |
15.4 |
55 |
98 |
77 |
9.1 |
13.8 |
11.5 |
17 |
2.7 |
66 |
0.4 |
1012 |
1013 |
1013 |
9.2 |
6.1 |
Sunny intervals all day |
|
12 |
7.9 |
15.4 |
11.7 |
74 |
98 |
86 |
6.9 |
14.6 |
10.8 |
19 |
2.9 |
69 |
16.4 |
1007 |
1014 |
1010 |
7.6 |
1.7 |
Rain all day |
|
13 |
10.6 |
18.0 |
14.3 |
77 |
98 |
88 |
9.6 |
15.8 |
12.7 |
21 |
3.4 |
81 |
2.8 |
1000 |
1007 |
1003 |
9.2 |
1.5 |
Sunny ints and showers |
|
14 |
13.8 |
18.8 |
16.3 |
67 |
96 |
82 |
12.4 |
15.0 |
13.7 |
13 |
2.1 |
52 |
4.2 |
1001 |
1010 |
1005 |
14.1 |
1.3 |
Sunny ints am, cloudy pm |
|
15 |
11.2 |
18.7 |
15.0 |
55 |
96 |
76 |
9.1 |
12.4 |
10.8 |
15 |
2.4 |
58 |
0.2 |
1010 |
1020 |
1015 |
10.7 |
4.2 |
Sunny intervals all day |
|
16 |
12.2 |
18.9 |
15.6 |
70 |
96 |
83 |
9.8 |
16.4 |
13.1 |
22 |
4.0 |
97 |
3.0 |
1020 |
1021 |
1020 |
10.3 |
0.3 |
Sunny ints am, cloudy pm |
|
17 |
15.1 |
22.8 |
19.0 |
72 |
88 |
80 |
12.8 |
18.0 |
15.4 |
16 |
2.5 |
59 |
0.0 |
1021 |
1025 |
1023 |
14.3 |
4.8 |
Sunny intervals all day |
|
18 |
12.9 |
19.4 |
16.2 |
76 |
98 |
87 |
11.7 |
17.7 |
14.7 |
20 |
3.5 |
84 |
7.4 |
1010 |
1022 |
1016 |
11.8 |
1.3 |
Sunny ints and showers |
|
19 |
12.9 |
20.0 |
16.5 |
60 |
94 |
77 |
10.2 |
13.7 |
12.0 |
18 |
3.4 |
82 |
0.0 |
1010 |
1014 |
1012 |
11.4 |
6.4 |
Sunny intervals all day |
|
20 |
9.6 |
20.4 |
15.0 |
52 |
98 |
75 |
8.4 |
15.3 |
11.9 |
14 |
1.7 |
45 |
0.0 |
1014 |
1020 |
1017 |
9.0 |
4.6 |
Sunny intervals all day |
|
21 |
7.6 |
21.1 |
14.4 |
61 |
98 |
80 |
6.2 |
15.2 |
10.7 |
12 |
1.7 |
40 |
0.0 |
1020 |
1026 |
1023 |
6.4 |
10.3 |
Sunny intervals all day |
|
22 |
10.8 |
21.9 |
16.4 |
57 |
98 |
78 |
9.8 |
15.4 |
12.6 |
13 |
2.3 |
55 |
0.0 |
1025 |
1027 |
1026 |
10.3 |
14.8 |
Sunny all day |
|
23 |
8.8 |
22.2 |
15.5 |
61 |
99 |
80 |
7.5 |
16.5 |
12.0 |
14 |
2.3 |
54 |
0.0 |
1020 |
1025 |
1022 |
7.7 |
14.8 |
Sunny all day |
|
24 |
9.1 |
25.3 |
17.2 |
50 |
98 |
74 |
7.9 |
16.0 |
12.0 |
11 |
2.6 |
57 |
0.0 |
1016 |
1020 |
1018 |
7.7 |
14.9 |
Sunny all day |
|
25 |
10.9 |
28.5 |
19.7 |
45 |
97 |
71 |
9.7 |
18.2 |
14.0 |
10 |
1.7 |
41 |
0.0 |
1016 |
1017 |
1016 |
9.4 |
14.9 |
Sunny all day |
|
26 |
13.3 |
26.5 |
19.9 |
52 |
97 |
75 |
12.3 |
17.5 |
14.9 |
12 |
1.2 |
29 |
0.0 |
1015 |
1017 |
1016 |
12.1 |
11.9 |
Sunny intervals all day |
|
27 |
15.0 |
26.2 |
20.6 |
49 |
95 |
72 |
10.7 |
16.4 |
13.6 |
17 |
3.4 |
81 |
0.0 |
1011 |
1015 |
1013 |
13.8 |
12.8 |
Sunny all day |
|
28 |
9.2 |
20.8 |
15.0 |
44 |
97 |
71 |
7.4 |
12.5 |
10.0 |
15 |
2.9 |
70 |
0.0 |
1011 |
1012 |
1012 |
7.3 |
10.0 |
Sunny intervals all day |
|
29 |
9.4 |
19.7 |
14.6 |
48 |
97 |
73 |
7.1 |
12.3 |
9.7 |
16 |
2.4 |
58 |
0.0 |
1011 |
1014 |
1012 |
7.4 |
9.3 |
Sunny intervals all day |
|
30 |
7.3 |
20.4 |
13.9 |
43 |
98 |
71 |
6.0 |
12.1 |
9.1 |
16 |
2.1 |
51 |
0.0 |
1014 |
1016 |
1015 |
5.6 |
6.0 |
Sunny intervals all day |
|
31 |
13.6 |
21.2 |
17.4 |
76 |
97 |
87 |
10.7 |
17.3 |
14.0 |
22 |
4.4 |
106 |
1.0 |
1012 |
1016 |
1014 |
12.9 |
4.5 |
Cloudy am, sunny pm |
|
|
11.6 |
20.3 |
15.9 |
65 |
97 |
81 |
10.1 |
15.3 |
12.7 |
17 |
2.9 |
2129 |
123 |
1011 |
1016 |
1013 |
10.6 |
185.7 |
|
Graphs for
July 2012 |
 |
|
Figure 1. Temperature and
Rainfall for July 2012. |
 |
|
Figure 2. Sunshine, UV
Index and solar irradiance for July 2012. |
 |
|
Figure 3.
Wind direction for July 2012. |
 |
|
Figure 4. Sea surface
temperature & cooling/heating days for July 2012. |
 |
|
Figure 5.
Mean wind speed, calm hours and air pressure for July 2012. |
|