|
March 2012 |
|
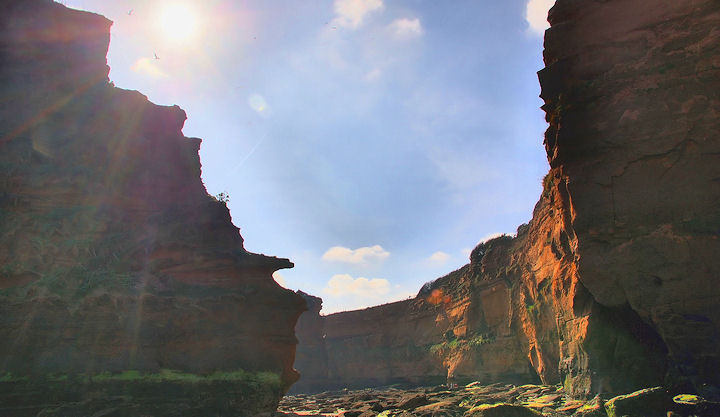
Spectacular Triassic sandstone cliffs
and sea stacks at the western end of Jacob's Ladder Beach, Sidmouth
on a warm and sunny March day |
|
Summary for |
March
2012 |
|
Mean Max: |
14.1ºC |
(+3.5ºC) |
|
Mean Min: |
4.5ºC |
(+0.9ºC) |
|
Mean: |
9.3ºC |
(+2.2ºC) |
|
Mean (integrated): |
8.6ºC |
|
|
|
|
|
|
High Max: |
21.6ºC |
29th |
|
Low Max: |
8.2ºC |
13th |
|
High Min: |
10.1ºC |
22nd |
|
Low Min: |
-1.4ºC |
6th |
|
Mean Grass Min: |
1.9ºC |
|
|
Grass Min: |
-3.9ºC |
6th |
|
|
|
|
|
Rain Total (gauge): |
0.0 mm |
(0%) |
|
Rain Total (tipping bucket): |
14.4 mm |
(22%) |
|
Rain Days >0.2 mm: |
4 Days |
|
|
Rain Days >1.0 mm: |
2 Days |
|
|
Max 24 hrs: |
10.4 mm |
4th |
|
Days without any rain: |
27 |
|
|
|
|
|
|
Air Frost: |
3 Days |
|
|
Ground Frost: |
6 Days |
|
|
Snow Falling: |
0 Days |
|
|
Snow (50%) @ 9am: |
0 Days |
|
|
Thunder Heard: |
0 Days |
|
|
Hail <5 mm: |
0 Days |
|
|
Hail >5 mm: |
0 Days |
|
|
Fog @ 9am: |
5 Days |
|
|
|
|
|
|
Total Monthly Sunshine: |
189.5 Hours |
(126%) |
|
Most Sunshine in a Day: |
11.9 Hours |
29th |
|
Average Daily Sunshine: |
6.1 Hours |
|
|
Sunless Days: |
7 Days |
|
|
Cloudless Days: |
8 Days |
|
|
Total Possible Sunshine: |
370 Hours |
|
|
Percentage of Total Sun: |
51% |
|
|
Maximum UV Index: |
4.6 |
27th @ 13:15 |
|
|
|
|
|
Mean Soil Temp @ 30 cm: |
|
|
|
Min Soil Temp @ 30 cm: |
|
|
|
Max Soil Temp @ 30 cm: |
|
|
|
Mean Soil Temp @ 100 cm: |
|
|
|
Min Soil Temp @ 100 cm: |
|
|
|
Max Soil Temp @ 100 cm: |
|
|
|
|
|
|
|
Mean 10 Min Wind >39 mph: |
0.00 Days |
|
|
N: |
10.42 Days |
|
|
NE: |
0.88 Days |
|
|
E: |
3.08 Days |
|
|
SE: |
1.92 Days |
|
|
S: |
5.67 Days |
|
|
SW: |
2.18 Days |
|
|
W: |
0.40 Days |
|
|
NW: |
5.67 Days |
|
|
Calm: |
0.78 Days |
|
|
Wind Chill Low: |
-3.0ºC |
19th |
|
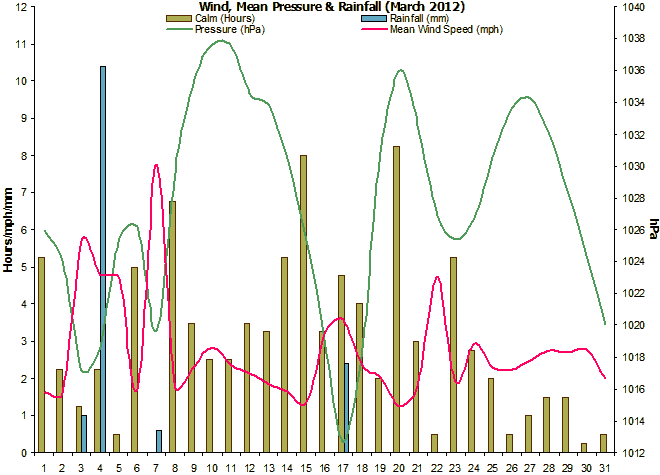
Mean Wind: |
2.7 mph |
|
|
Max Gust: |
26 mph |
4th |
|
|
31.00 Days |
|
|
Mean Cloud Cover: |
66% |
|
|
Mean RH @ 9am: |
90% |
|
|
Rain Duration >0.1mm/hour: |
11.8 Hours |
|
|
Frost Duration: |
15.3 Hours |
|
|
Max Frost Duration in a Day: |
6.0 Hours |
6th |
|
|
|
|
|
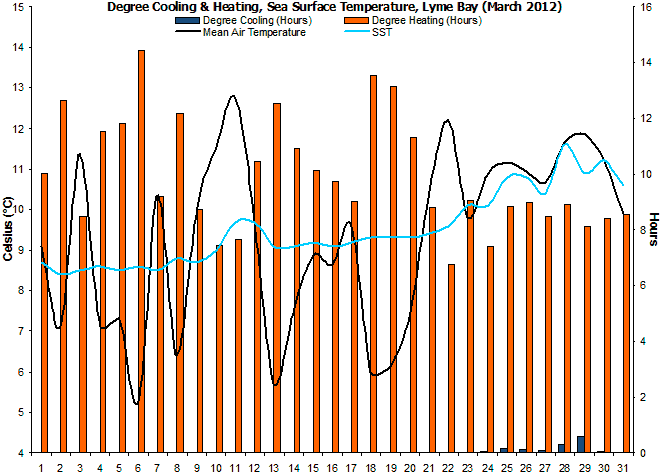
Mean Sea Temperature: |
9.5ºC |
(+0.8ºC) |
|
Normal for Month: |
8.7ºC |
|
|
Max Sea Temperature: |
11.6ºC |
28th |
|
Min Sea Temperature: |
8.4ºC |
2nd |
|
|
|
|
|
Mean Pressure @ 9am: |
1027.9 hPa |
(+13.4 hPa) |
|
Mean Pressure: |
1027.5 hPa |
(+13.0 hPa) |
|
Max Pressure: |
1039.3 hPa |
11th |
|
Min Pressure: |
1009.9 hPa |
17th |
|
|
|
|
|
Radiation Daily Mean |
11.7 MJ/m² |
|
|
Max Daily Value |
20.3 MJ/m² |
29th |
|
Min Daily Value |
2.9 MJ/m² |
16th |
|
Number of Days with Data |
31 Days |
|
|
1-Hour Maximum |
803 W/m² |
21st |
|
Starting Time of the Hour |
|
13:00 |
|
|
|
|
|
Max Dewpoint: |
11.5ºC |
12th |
|
Min Dewpoint: |
-2.5ºC |
6th |
|
Mean Dewpoint: |
5.4ºC |
|
|
|
|
|
|
Max Humidity: |
99% |
2nd |
|
Min Humidity: |
29% |
29th |
|
Mean Humidity: |
80% |
(-1) |
|
|
A sunny, warm and very dry month.
This
month started fine and sunny but became unsettled from
the 4th to the 7th. After that things settled down and
the month became dry, but with a few cloudy and/or foggy
days as well. From the 17th onwards it became
increasingly sunny and warmer. |
|
Rainfall was well below
the average and occurred on just 4 days. This was the driest
month since before 2005 and continues a run of months
with lower than average rainfall. |
|
There
were just 3 air frosts, all of which were slight, and
there were 6 ground frosts. No snow was seen falling but
it was a rather foggy month at times with 3
consecutively foggy days from the 13th to the 15th. |
|
Sunshine
levels were rather above the long term average for
March. There were 8 consecutively sunny days with
unbroken sunshine from the 23rd to the 30th. |
|
No soil temperature
readings were taken due to relocation of sensors. |
|
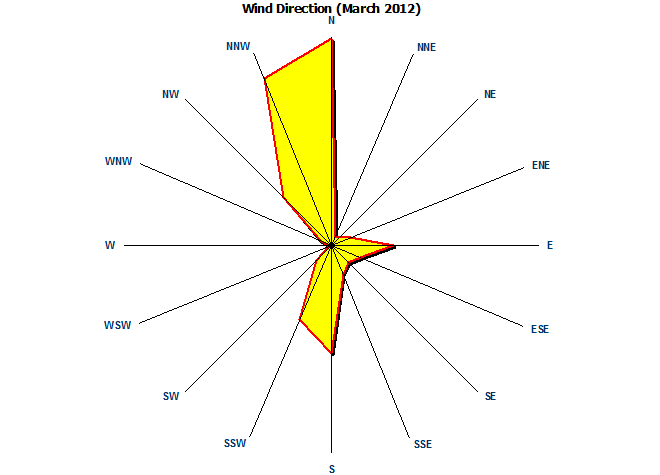
Interestingly, for a month
that was so warm the dominant wind direction was
northerly. On the whole winds were generally
light with the monthly maximum gust of only 26 mph. |
|
Rainfall of any
significance only fell on just 1 out of the 31 days. |
|
Sea surface temperatures
rose slowly from the 10th onwards. |
|
Mean pressure was well
above the average for March and indicative of the settled nature
of this month. |
|
A new sensor has been
added that measures solar irradiance in watts per square
metre falling on a horizontal surface. |
|
Dewpoints were often below
the average due to a dry, Continental airstream from
mid-month onwards. |
|
Despite the lower than
average dewpoint, the relative humidity was
only slightly below normal. |
|
|
|
Weather Data for Otter Valley, Devon. |
March 2012 |
|
|
|
Temp (oC) |
Hum (RH%) |
Dewpoint (oC) |
Wind (mph) |
Rain |
Pressure (hPa) |
Grass |
Sun |
|
|
|
Min |
Max |
Ave |
Min |
Max |
Ave |
Min |
Max |
Ave |
Max |
Ave |
Run |
mm |
Min |
Max |
Ave |
Min |
Hours |
Observations |
|
1 |
6.6 |
11.6 |
9.1 |
84 |
97 |
91 |
4.5 |
9.2 |
6.9 |
10 |
1.6 |
39 |
0.0 |
1024 |
1028 |
1026 |
4.1 |
4.8 |
Foggy am, then sun |
|
2 |
2.3 |
11.9 |
7.1 |
81 |
99 |
90 |
1.4 |
9.2 |
5.3 |
11 |
1.6 |
38 |
0.0 |
1021 |
1028 |
1024 |
-1.5 |
2.8 |
Sunny ints am, sea fog pm |
|
3 |
8.4 |
14.3 |
11.4 |
57 |
98 |
78 |
4.3 |
9.1 |
6.7 |
24 |
5.7 |
137 |
1.0 |
1014 |
1020 |
1017 |
1.2 |
8.1 |
Sunny intervals all day |
|
4 |
5.9 |
8.3 |
7.1 |
60 |
98 |
79 |
0.0 |
7.8 |
3.9 |
26 |
4.8 |
115 |
10.4 |
1014 |
1024 |
1019 |
0.2 |
4.4 |
Rain am, sunny intervals pm |
|
5 |
4.1 |
10.5 |
7.3 |
59 |
87 |
73 |
0.2 |
3.7 |
2.0 |
23 |
4.7 |
113 |
0.0 |
1024 |
1027 |
1025 |
-1.5 |
6.6 |
Sunny intervals all day |
|
6 |
-1.4 |
11.9 |
5.3 |
57 |
98 |
78 |
-2.5 |
6.0 |
1.8 |
12 |
1.7 |
41 |
0.0 |
1025 |
1028 |
1026 |
-3.9 |
7.7 |
Sunny intervals all day |
|
7 |
7.8 |
12.9 |
10.4 |
60 |
96 |
78 |
2.6 |
10.3 |
6.5 |
26 |
7.8 |
186 |
0.6 |
1015 |
1025 |
1020 |
1.7 |
5.8 |
Rain am, then sunny ints |
|
8 |
0.3 |
12.5 |
6.4 |
57 |
98 |
78 |
-1.1 |
5.9 |
2.4 |
13 |
1.8 |
43 |
0.0 |
1024 |
1035 |
1030 |
-2.3 |
5.9 |
Sunny intervals all day |
|
9 |
7.2 |
12.9 |
10.1 |
70 |
90 |
80 |
3.8 |
8.3 |
6.1 |
11 |
2.3 |
56 |
0.0 |
1035 |
1036 |
1035 |
5.8 |
0.0 |
Cloudy all day |
|
10 |
8.6 |
14.5 |
11.6 |
76 |
95 |
86 |
6.7 |
10.7 |
8.7 |
14 |
2.8 |
68 |
0.0 |
1036 |
1039 |
1038 |
3.8 |
2.4 |
Sunny intervals all day |
|
11 |
8.9 |
16.6 |
12.8 |
65 |
95 |
80 |
5.1 |
10.7 |
7.9 |
10 |
2.3 |
56 |
0.0 |
1036 |
1039 |
1038 |
3.4 |
8.2 |
Cloudy am, sunny pm |
|
12 |
3.7 |
15.7 |
9.7 |
75 |
98 |
87 |
2.6 |
11.5 |
7.1 |
10 |
2.1 |
51 |
0.0 |
1033 |
1036 |
1035 |
2.6 |
6.9 |
Foggy am, then sunny |
|
13 |
3.2 |
8.2 |
5.7 |
92 |
98 |
95 |
2.0 |
7.8 |
4.9 |
8 |
1.8 |
44 |
0.0 |
1033 |
1035 |
1034 |
1.2 |
0.0 |
Foggy all day |
|
14 |
6.8 |
8.3 |
7.6 |
85 |
97 |
91 |
5.4 |
7.1 |
6.3 |
14 |
1.7 |
40 |
0.0 |
1028 |
1033 |
1030 |
6.8 |
0.0 |
Foggy all day |
|
15 |
7.2 |
10.5 |
8.9 |
91 |
98 |
95 |
5.6 |
9.2 |
7.4 |
12 |
1.3 |
32 |
0.0 |
1023 |
1028 |
1025 |
7.0 |
0.0 |
Foggy all day |
|
16 |
7.2 |
10.1 |
8.7 |
82 |
95 |
89 |
4.8 |
8.0 |
6.4 |
14 |
3.2 |
77 |
0.0 |
1015 |
1023 |
1019 |
6.8 |
0.0 |
Foggy am, cloudy pm |
|
17 |
7.1 |
12.1 |
9.6 |
74 |
98 |
86 |
4.8 |
9.7 |
7.3 |
20 |
3.6 |
87 |
2.4 |
1010 |
1015 |
1013 |
1.4 |
2.6 |
Sunny intervals all day |
|
18 |
-0.6 |
12.6 |
6.0 |
60 |
98 |
79 |
-1.4 |
6.9 |
2.8 |
17 |
2.4 |
57 |
0.0 |
1011 |
1026 |
1019 |
-1.7 |
8.4 |
Sunny intervals all day |
|
19 |
-1.4 |
13.7 |
6.2 |
52 |
98 |
75 |
-2.4 |
6.9 |
2.3 |
12 |
2.0 |
49 |
0.0 |
1026 |
1036 |
1031 |
-2.8 |
8.6 |
Sunny intervals all day |
|
20 |
3.2 |
11.7 |
7.5 |
70 |
94 |
82 |
1.1 |
7.6 |
4.4 |
10 |
1.2 |
32 |
0.0 |
1035 |
1037 |
1036 |
0.5 |
0.0 |
Cloudy all day |
|
21 |
6.1 |
14.8 |
10.5 |
65 |
91 |
78 |
3.1 |
8.9 |
6.0 |
11 |
1.8 |
43 |
0.0 |
1029 |
1036 |
1033 |
3.5 |
7.9 |
Cloudy am, then sunny |
|
22 |
10.1 |
14.3 |
12.2 |
58 |
87 |
73 |
3.1 |
7.6 |
5.4 |
20 |
4.7 |
114 |
0.0 |
1025 |
1029 |
1027 |
7.1 |
5.1 |
Cloudy am, sunny ints pm |
|
23 |
3.6 |
16.0 |
9.8 |
70 |
98 |
84 |
2.2 |
11.0 |
6.6 |
13 |
1.9 |
46 |
0.0 |
1025 |
1026 |
1025 |
2.2 |
11.4 |
Sunny all day |
|
24 |
2.9 |
18.9 |
10.9 |
54 |
97 |
76 |
1.7 |
10.3 |
6.0 |
15 |
3.0 |
65 |
0.0 |
1025 |
1028 |
1027 |
1.2 |
11.4 |
Sunny all day |
|
25 |
2.6 |
19.7 |
11.2 |
41 |
98 |
70 |
1.3 |
9.4 |
5.4 |
12 |
2.3 |
55 |
0.0 |
1028 |
1033 |
1031 |
1.3 |
11.8 |
Sunny all day |
|
26 |
2.2 |
19.7 |
11.0 |
38 |
96 |
67 |
0.8 |
10.5 |
5.7 |
15 |
2.3 |
54 |
0.0 |
1033 |
1035 |
1034 |
1.0 |
11.7 |
Sunny all day |
|
27 |
2.3 |
19.0 |
10.7 |
47 |
96 |
72 |
0.5 |
8.3 |
4.4 |
13 |
2.5 |
60 |
0.0 |
1033 |
1035 |
1034 |
0.8 |
11.7 |
Sunny all day |
|
28 |
2.1 |
21.2 |
11.7 |
40 |
96 |
68 |
0.7 |
9.3 |
5.0 |
13 |
2.7 |
66 |
0.0 |
1030 |
1034 |
1032 |
0.6 |
11.8 |
Sunny all day |
|
29 |
2.1 |
21.6 |
11.9 |
29 |
95 |
62 |
0.4 |
6.4 |
3.4 |
15 |
2.7 |
65 |
0.0 |
1027 |
1030 |
1029 |
0.5 |
11.9 |
Sunny all day |
|
30 |
3.2 |
19.2 |
11.2 |
51 |
96 |
74 |
1.6 |
10.4 |
6.0 |
11 |
2.8 |
67 |
0.0 |
1022 |
1027 |
1024 |
1.9 |
11.6 |
Sunny all day |
|
31 |
6.8 |
13.0 |
9.9 |
67 |
93 |
80 |
5.1 |
7.8 |
6.5 |
11 |
2.0 |
47 |
0.0 |
1019 |
1022 |
1020 |
4.5 |
0.0 |
Cloudy all day |
|
|
4.5 |
14.1 |
9.3 |
63 |
96 |
80 |
2.3 |
8.6 |
5.4 |
14 |
2.7 |
2038 |
14.4 |
1025 |
1030 |
1028 |
1.9 |
189.5 |
|
Graphs for
March 2012 |
 |
|
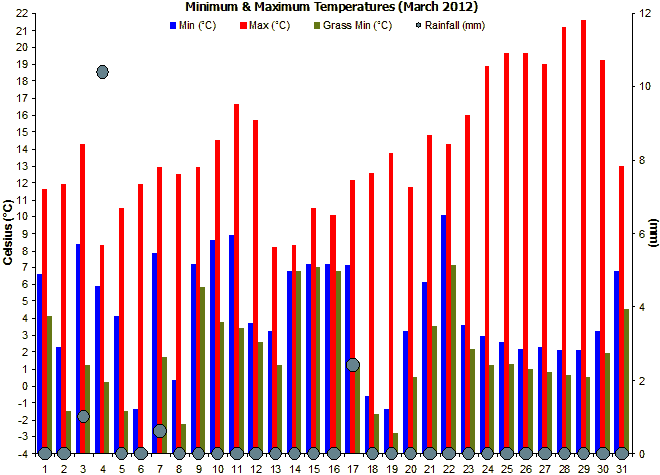
Figure 1. Temperature and
Rainfall for March 2012. |
 |
|
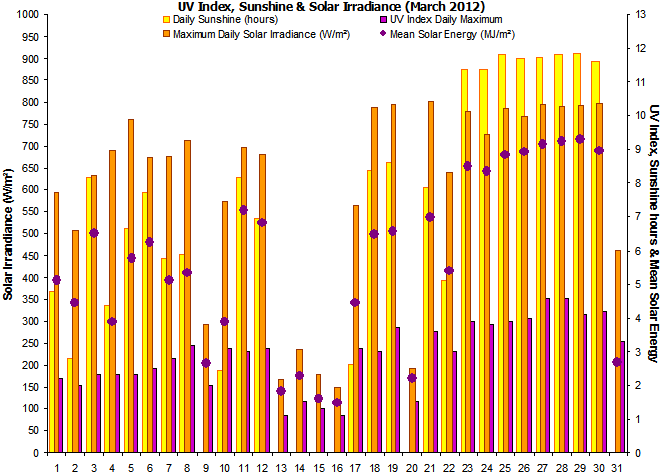
Figure 2. Sunshine, UV
Index and solar irradiance for March 2012. |
 |
|
Figure 3.
Wind direction for March 2012. |
 |
|
Figure 4. Sea surface
temperature & cooling/heating days for March 2012. |
 |
|
Figure 5.
Mean wind speed, calm hours and air pressure for March 2012. |
|