|
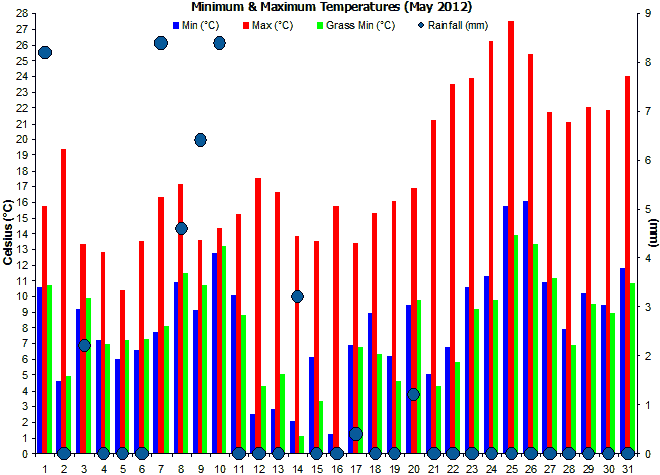
A cool, wet start then warmer and increasingly sunny.
This
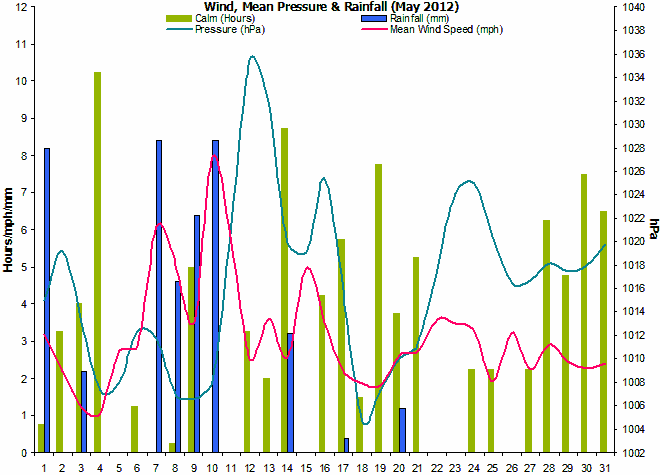
May was a month of contrasts, with a cool and wet spell
from the 3rd to the 6th, then average temperatures up
until the 20th. From then on it was very warm, sunny and
dry.
This was
the warmest May since 2008. |
|
Rainfall was below
the average, with only 4.8 mm falling from the 11th to
the 31st. By the end of the month soil conditions were
extremely dry. |
|
As with
all previous Mays, there
were no air frosts, but there was one grass frost on the
16th with -0.2°C. |
|
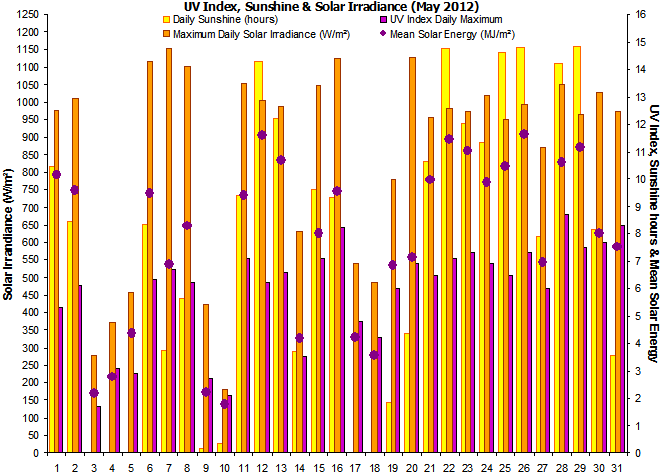
As can be
expected from a warm and dry month, the sunshine levels
were a little above average even though there were 4
sunless days. |
|
No soil temperature
readings were taken due to relocation of sensors. |
|
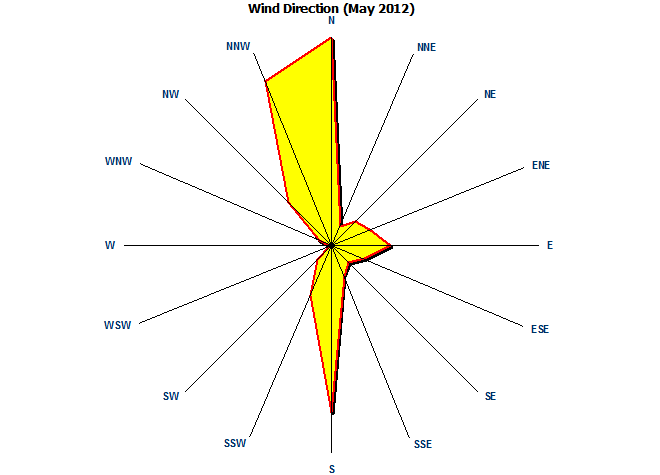
The dominant wind direction was
northerly with wind from a southerly direction also
featuring on a large number of days. This was due to
frequent sea breezes and typical for this month. |
|
Rainfall duration was just
39
hours and representative of the dry nature of this
month. |
|
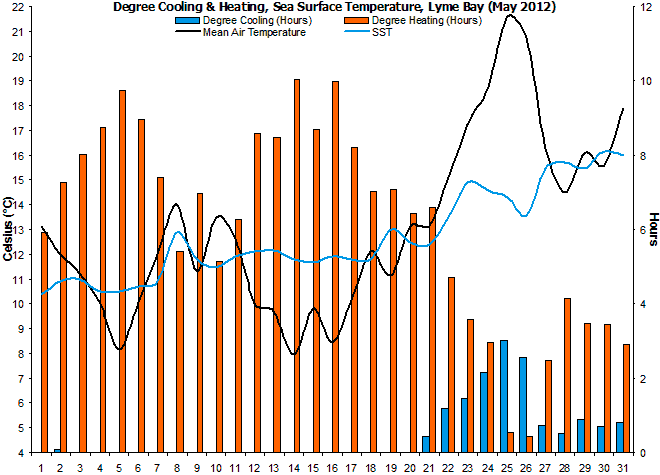
Sea surface temperatures
gradually increased up until the 20th, then increased
more sharply and ending up above average. Though
overall, the SST was average due to the cool start. |
|
Mean pressure was slightly
above the average for May and indicative of the
generally settled nature
of this month, especially from the 3rd week onwards. |
|
A new sensor has been
added that measures solar irradiance in watts per square
metre falling on a horizontal surface. |
|
Dewpoints were often well
above
the average, and on the 25th the dewpoint reached
20.5°C, this is very high for the month of May. |
|
Despite the much higher than
average dewpoints, the relative humidity was
only slightly above normal. |