|
An
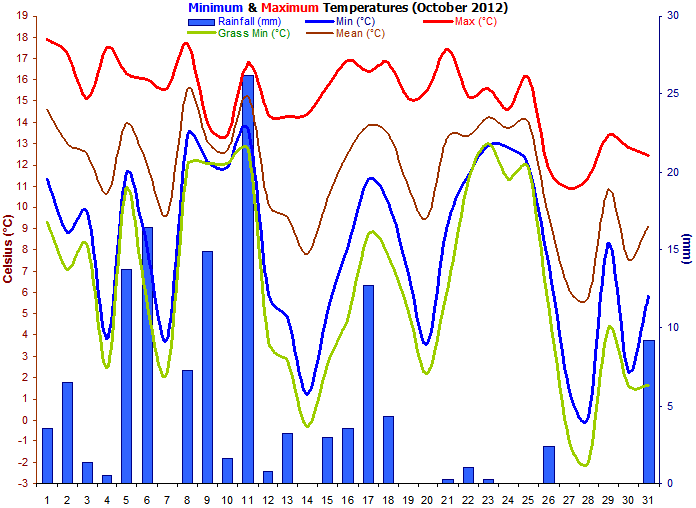
unsettled, often cloudy and wet month with temperatures
slightly above the long term average.
Mild to
warm right until the final week of the month though the
temperature did not exceed 20°C on any day, something
that would normally be expected during October
(especially the first half). A cold night on the 28th
nearly led to a rare October air frost. |
|
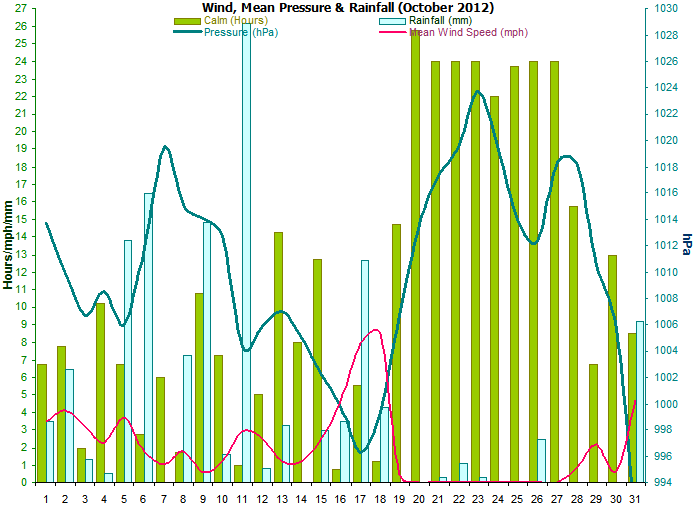
October is normally a wet
month but this October was wetter than the average and
follows a trend of wet months set since April this year. |
|
As
expected for October, there
were no air frosts but there were 3 ground frosts. Unusually, no thunder was
heard. It was foggy at 9am on 2 mornings. |
|
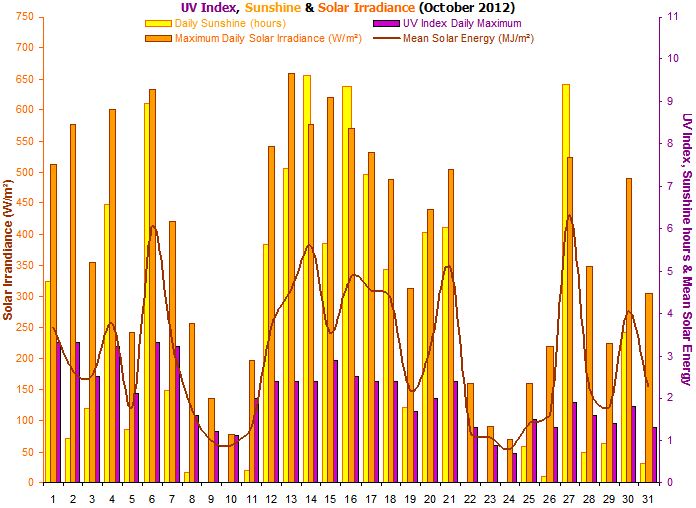
Sunshine
amounts were lower than the average and continues a
trend of duller than normal months set in June this year.
There were 3 consecutively sunless days (a rare event)
form the 22nd to the 24th. |
|
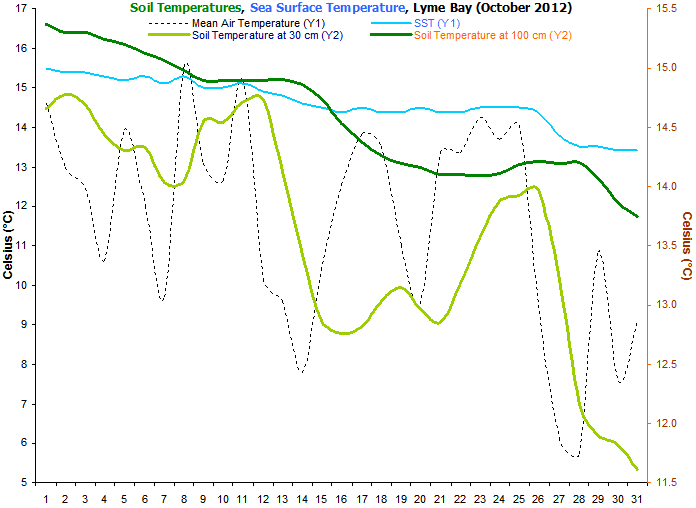
Soil temperatures slowly declined during the first half of the month, but
then the temperatures fell more rapidly as the weather
turned cooler. |
|
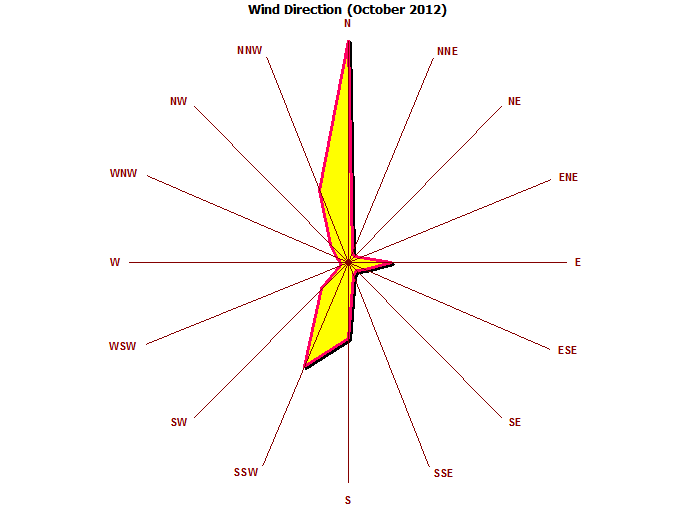
The wind recording
(anemometer and wind vane) readings are incomplete this
month due to a mouse chewing through the Ethernet
cables. There were no readings from the 19th to the
28th. |
|
Rainfall duration was well
above the average with a total of 58.5
hours for the entire month. The only 'prolonged' dry
spell was from the 27th to the 30th, though the first
half of the month was substantially more wetter than the
second half. |
|
Sea surface temperatures
stayed reasonably high until the 25th then dropped
significantly due to a run of cold nights. |
|
Mean pressure was rather
below the average for October and indicative of the
unsettled nature of this month. |
|
A new sensor has been
added that measures solar irradiance in watts per square
metre falling on a horizontal surface. |
|
Dewpoints were slightly
below
the average. |
|
Relative humidity was
a little above normal. |