September 2012

Over the border and into Jurassic Coast of west Dorset.<br>A walk along the beach near Thorncombe Beacon on a hot and sunny August day.
A little cove near Bolberry Down in South Devon and perfect for a swim in the late-summer warmed sea.

Summary for  September 2012
Mean Max: 19.1ºC (+0.6ºC)
Mean Min: 9.3ºC (-0.7ºC)
Mean: 14.2ºC (-0.1ºC)
     
High Max: 24.3ºC 7th
Low Max: 12.4ºC 23rd 
High Min: 14.6ºC 4th
Low Min: 3.3ºC 19th
Mean Grass Min: 7.4ºC  
Grass Min: 1.7ºC 19th
     
Rain Total (gauge): 73.8 mm (153%)
Rain Total (tipping bucket): 61.2 mm (127%)
Rain Days >0.2 mm: 7 Days  
Rain Days >1.0 mm: 4 Days  
Max 24 hrs: 32.2 mm 24th
Days without any rain: 23  
     
Air Frost: 0 Days  
Grass Frost: 0 Days  
Snow Falling: 0 Days  
Snow (50%) @ 9am: 0 Days  
Ice Days: 0 Days  
Thunder Heard: 0 Days  
Hail <5 mm: 0 Days  
Hail >5 mm: 0 Days  
Fog @ 9am: 3 Days  
     
Total Monthly Sunshine: 163.9 Hours (70%)
Most Sunshine in a Day: 12.6 Hours 5th
Average Daily Sunshine: 5.5 Hours  
Sunless Days: 1 Day  
Cloudless Days: 2 Days  
Total Possible Sunshine: 377.7 Hours  
Percentage of Total Sun: 43%  
Maximum UV Index: 6.1 1st
Time of Max UV:   14:00
     
Mean Soil Temp @ 30 cm: 16.5ºC  
Min Soil Temp @ 30 cm: 14.5ºC 30th
Max Soil Temp @ 30 cm: 18.3ºC 5th
Mean Soil Temp @ 100 cm: 16.7ºC  
Min Soil Temp @ 100 cm: 15.4ºC 30th
Max Soil Temp @ 100 cm: 17.4ºC 1st
     
Mean 10 Min Wind >39 mph: 0.01 Days  
N: 7.23 Days  
NE: 0.77 Days  
E: 1.06 Days  
SE: 0.99 Days  
S: 5.12 Days  
SW: 4.14 Days  
W: 1.44 Days  
NW: 5.52 Days  
Calm: 4.73 Days  
Wind Chill Low: 2.9ºC 19th
Mean Wind: 2.1 mph  
Max Gust: 24 mph 24th
  31.00 Days  
Mean Cloud Cover: 59%  
Mean RH @ 9am: 95%  
Rain Duration >0.1mm/hour: 28.5 Hours  
Frost Duration: 0.0 Hours  
Max Frost Duration in a Day: 0.0 Hours 1st
     
Mean Sea Temperature: 17.0ºC (-0.4ºC)
Normal for Month: 17.4ºC  
Max Sea Temperature: 18.6ºC 6th
Min Sea Temperature: 15.6ºC 30th
     
Mean Pressure @ 9am: 1016.4 hPa (-1.0 hPa)
Mean Pressure: 1015.9 hPa (-1.4 hPa)
Max Pressure: 1030.6 hPa 1st
Min Pressure: 986.5 hPa 26th
   
Radiation Daily Mean: 9.9 MJ/m²  
Max Daily Value: 17.8 MJ/m² 5th
Min Daily Value: 1.9 MJ/m² 23rd 
Number of Days with Data: 30 Days  
1-Hour Maximum: 776 W/m² 3rd 
Starting Time of the Hour:   13:00
     
Max Dewpoint: 18.3ºC 3rd 
Min Dewpoint: 2.2ºC 19th
Mean Dewpoint: 10.9ºC  
     
Max Humidity: 99% 7th
Min Humidity: 46% 19th
Mean Humidity: 81% (+3)


Warm for the first two weeks, then much cooler and at times, wetter with less sunshine.

Summer continued until the 15th, then things turned cooler though it remained dry until the 23rd. During the second half of the month there were a few unusually cold nights, though no air or grass frosts were recorded. There was also an absence of any warm nights, which are normally quite prevalent in September, especially during the first two weeks of the month.

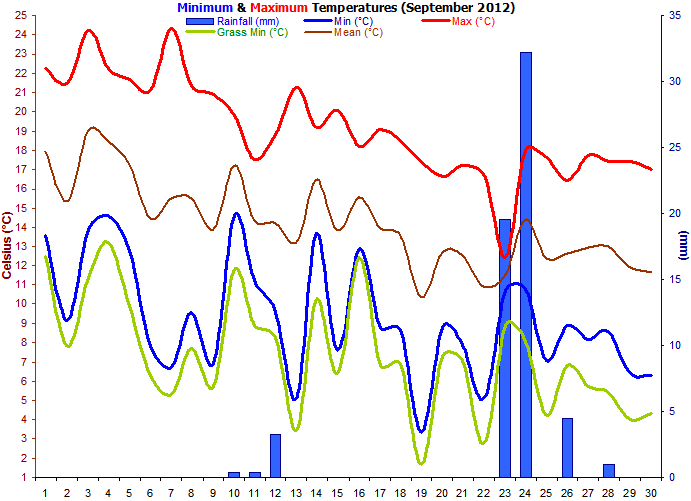
Rainfall was concentrated in one big downfall that lasted for over 24 hours and deposited 64.2 mm of rain in the gauge. This was more than the amount that fell on July 7th this year which resulted in serious flooding. This time there were no floods as there had been little rainfall leading up to the 23rd and the ground was dry.
As expected for September, there were no air frosts or grass frosts. Unusually, no thunder was heard. It was foggy at 9am on 3 mornings.
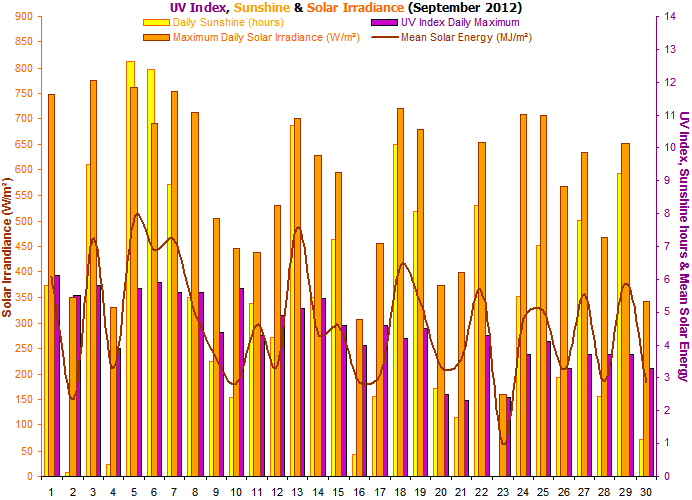
Sunshine amounts were reasonable though lower than the average. The amount of sunshine as a percentage of the total possible was higher than any of the summer months, and the highest since May (47%).
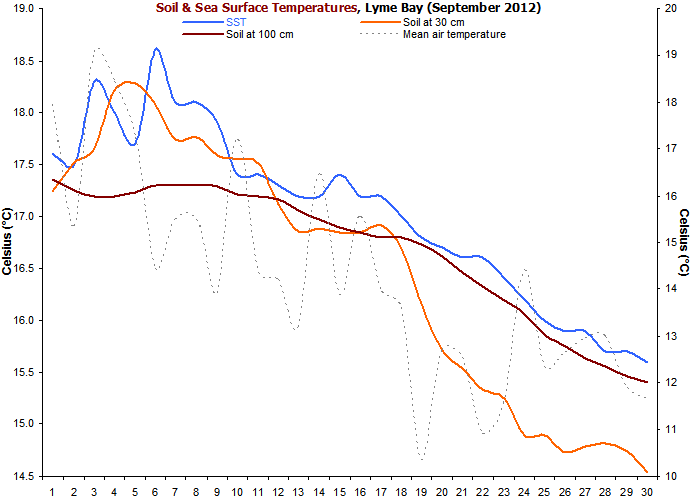
Soil temperatures only slowly declined during the first half of the month, but then the temperatures fell more rapidly as autumnal type weather dominated from the middle of the month onwards.
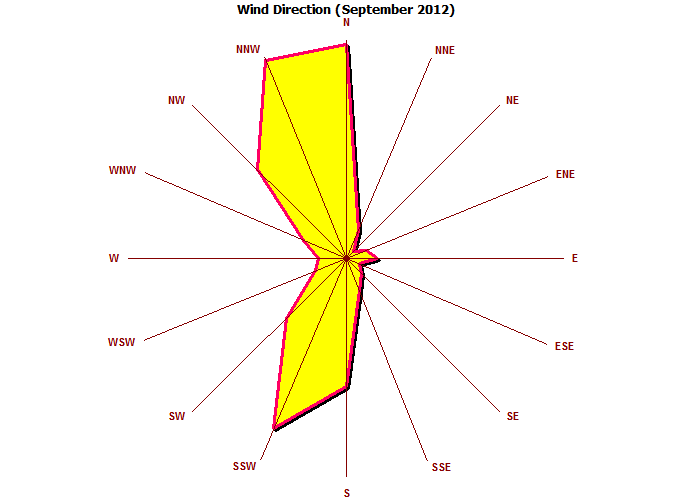
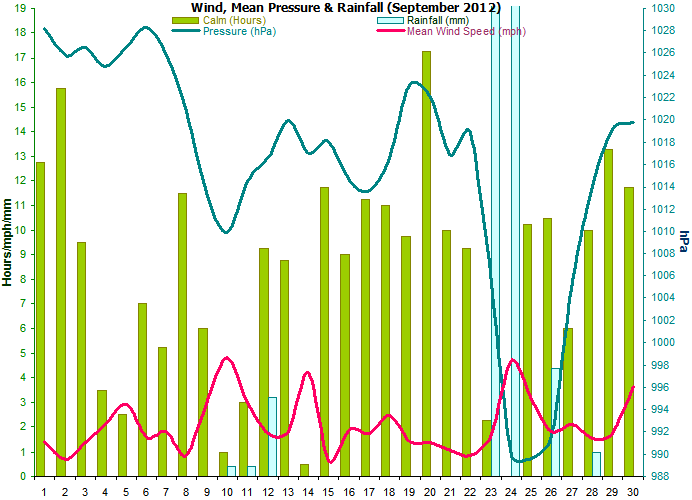
The dominant wind direction was from the north and north west, and therefore it was not surprising that this month ended up cooler than average. It was also a rather windless month with just 1501 wind run miles. This is the lowest for any month in the station record and very surprising for a September month.
Rainfall duration was a mere 28.5 hours even though the rainfall was well above the average. This was due to the overwhelming majority of the rainfall falling in just one event over the 23rd and 24th.
Sea surface temperatures increased during the first week but then started lowering, with the temperature drop accelerating as cooler conditions set in after mid-month.
Mean pressure was just slightly below the average for September but overall, it was settled for the first 3 weeks.
A new sensor has been added that measures solar irradiance in watts per square metre falling on a horizontal surface.
Dewpoints were slightly below the average.
Relative humidity was a little above normal.
Weather Data for Otter Valley, Devon.  September 2012  
  Temp oC Grass Hum (%) Soil oC DP (oC) Wind (mph) Rain Air (hPa)

W/m²

UV Sun  
  Min Max Min Min Max 30 100 Min Max Max Ave Run mm Min Max Max Max Hours Observations
1 13.6 22.3 12.5 62 96 17.2 17.4 10.9 15.8 14 1.4 34 0.0 1026 1031 748 6.1 5.8 Sunny intervals all day
2 9.2 21.5 7.8 77 98 17.5 17.3 8.2 17.1 9 0.7 17 0.0 1025 1027 349 5.5 0.1 Brief sunny intervals all day
3 13.9 24.2 11.4 68 98 17.7 17.2 13.0 18.3 11 1.4 33 0.0 1025 1028 776 5.8 9.5 Fog am, sunny pm
4 14.6 22.3 13.2 77 97 18.2 17.2 13.3 18.1 10 2.1 50 0.0 1024 1026 330 3.9 0.4 Brief sunny intervals all day
5 12.8 21.7 9.9 55 93 18.3 17.2 10.2 17.0 15 2.9 70 0.0 1025 1028 761 5.7 12.6 Sunny all day
6 7.8 21.1 6.3 58 98 18.1 17.3 6.7 13.8 10 1.6 37 0.0 1027 1030 690 5.9 12.4 Sunny all day
7 6.7 24.3 5.3 53 99 17.7 17.3 5.8 16.8 12 1.8 43 0.0 1024 1027 754 5.6 8.9 Fog early am, then sunny
8 9.6 21.4 7.7 52 99 17.8 17.3 8.2 16.3 9 0.8 20 0.0 1017 1025 713 5.6 5.4 Fog am, then sunny ints
9 6.9 20.9 5.7 76 99 17.6 17.3 6.1 16.9 17 3.1 74 0.0 1009 1017 505 4.4 3.5 Sunny intervals all day
10 14.6 19.8 11.8 82 98 17.5 17.2 13.6 17.2 18 4.8 116 0.4 1009 1011 446 5.7 2.4 Sunny ints am, cloudy pm
11 11.2 17.5 8.9 56 93 17.5 17.2 7.0 14.5 18 3.0 72 0.4 1010 1019 439 4.3 5.3 Sunny intervals all day
12 9.6 18.8 8.3 74 96 17.1 17.2 8.1 15.3 14 1.7 41 3.2 1015 1019 530 4.9 4.2 Sunny intervals all day
13 5.1 21.3 3.4 54 98 16.9 17.1 4.0 13.5 12 1.8 43 0.0 1017 1023 701 5.1 10.7 Sunny all day, cloudy late
14 13.7 19.2 10.2 62 90 16.9 17.0 11.2 15.4 20 4.2 101 0.0 1015 1019 627 5.4 5.4 Sunny intervals all day
15 7.6 20.1 6.4 70 99 16.8 16.9 7.0 15.4 9 0.7 16 0.0 1016 1020 595 4.6 7.2 Sunny intervals all day
16 12.9 18.2 12.4 71 93 16.8 16.8 11.3 14.0 12 1.9 45 0.0 1012 1017 308 4.0 0.7 Brief sunny intervals all day
17 8.8 19.1 6.8 57 98 16.9 16.8 7.9 14.2 15 1.7 41 0.0 1013 1015 455 4.6 2.4 Sunny intervals all day
18 8.7 18.5 6.9 48 98 16.7 16.8 6.7 11.1 17 2.5 59 0.0 1013 1021 720 4.2 10.1 Sunny intervals all day
19 3.3 17.4 1.7 46 99 16.2 16.7 2.2 8.8 13 1.4 34 0.0 1021 1026 679 4.5 8.1 Sunny intervals all day
20 8.8 16.6 7.3 70 97 15.7 16.6 7.5 11.9 13 1.4 36 0.0 1019 1025 373 2.5 2.7 Sunny intervals all day
21 7.9 17.2 7.1 71 97 15.5 16.5 7.1 12.4 12 1.1 25 0.0 1014 1019 399 2.3 1.8 Sunny intervals all day
22 5.1 16.7 2.8 56 98 15.3 16.3 4.0 8.9 11 0.9 21 0.0 1017 1021 653 4.3 8.3 Sunny intervals all day
23 10.7 12.4 8.9 74 98 15.2 16.2 7.1 11.6 15 1.7 41 19.6 994 1017 160 2.4 0.0 Rain all day
24 10.8 18.0 8.1 62 98 14.9 16.1 8.5 11.5 24 4.7 104 32.2 987 993 709 3.7 5.5 Rain am, then sunny ints
25 7.1 17.6 4.2 63 98 14.9 15.9 6.1 11.0 24 3.1 74 0.0 987 992 707 4.1 7.0 Sunny intervals all day
26 8.9 16.4 6.8 80 98 14.7 15.8 7.6 14.1 14 1.8 44 4.4 987 997 569 3.3 3.0 Sunny ints am, showers pm
27 8.2 17.7 5.7 64 99 14.8 15.6 7.3 12.6 15 2.1 50 0.0 997 1014 633 3.7 7.8 Sunny intervals all day
28 8.6 17.4 5.4 69 98 14.8 15.6 6.4 13.0 15 1.5 36 1.0 1013 1015 468 3.7 2.4 Sunny intervals all day
29 6.4 17.4 4.0 53 99 14.7 15.5 5.7 10.1 18 1.7 41 0.0 1016 1023 651 3.7 9.2 Sunny intervals all day
30 6.3 17.0 4.3 78 99 14.5 15.4 5.4 13.1 22 3.6 83 0.0 1016 1023 341 3.3 1.1 Brief sunny intervals all day
9.3 19.1 7.4 65 97 16 16.7 7.8 14.0 15 2.1 1501 61.2 1013 1019 560 4.4 164  

Graphs for September 2012

Figure 1. Temperature and Rainfall for September 2012.
Figure 2. Sunshine, UV Index and solar irradiance for September 2012.
Figure 3. Wind direction for September 2012.
Figure 4. Soil & Sea surface temperature for September 2012.
Figure 5. Mean wind speed, calm hours and air pressure for September 2012.