|
10:00 |
|
10:15 |
|
10:30 |
|
10:45 |
|
11:00 |
|
11:15 |
|
11:30 |
|
11:45 |
|
12:00 |
|
12:15 |
|
12:30 |
|
12:45 |
|
13:00 |
|
13:15 |
|
13:30 |
|
13:45 |
|
14:00 |
|
|
963.5 |
|
962.9 |
|
962.4 |
|
961.9 |
|
962.1 |
|
961.6 |
|
961.4 |
|
961.1 |
|
961.3 |
|
961.6 |
|
962.0 |
|
962.1 |
|
962.6 |
|
963.2 |
|
963.3 |
|
964.0 |
|
965.0 |
|
|
6.9 |
|
6.9 |
|
7.6 |
|
7.9 |
|
7.9 |
|
7.9 |
|
8.7 |
|
9.8 |
|
10.2 |
|
9.9 |
|
9.8 |
|
9.5 |
|
9.1 |
|
8.6 |
|
8.4 |
|
8.5 |
|
7.7 |
|
|
85 |
|
86 |
|
86 |
|
85 |
|
85 |
|
85 |
|
83 |
|
82 |
|
74 |
|
74 |
|
77 |
|
78 |
|
79 |
|
81 |
|
83 |
|
82 |
|
82 |
|
|
27 |
|
31 |
|
22 |
|
33 |
|
28 |
|
31 |
|
24 |
|
26 |
|
36 |
|
35 |
|
29 |
|
40 |
|
34 |
|
38 |
|
27 |
|
33 |
|
43 |
|
|
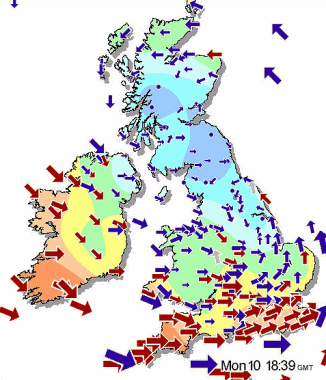
SSW |
|
SSW |
|
SW |
|
SW |
|
SW |
|
SW |
|
SW |
|
SW |
|
SW |
|
WSW |
|
WSW |
|
WSW |
|
W |
|
W |
|
W |
|
W |
|
WNW |
|